
Traders are closely watching whether THE cryptocurrency can maintain this momentum and move higher. With accumulation building up, the stage seems set for a meaningful move in the near future.
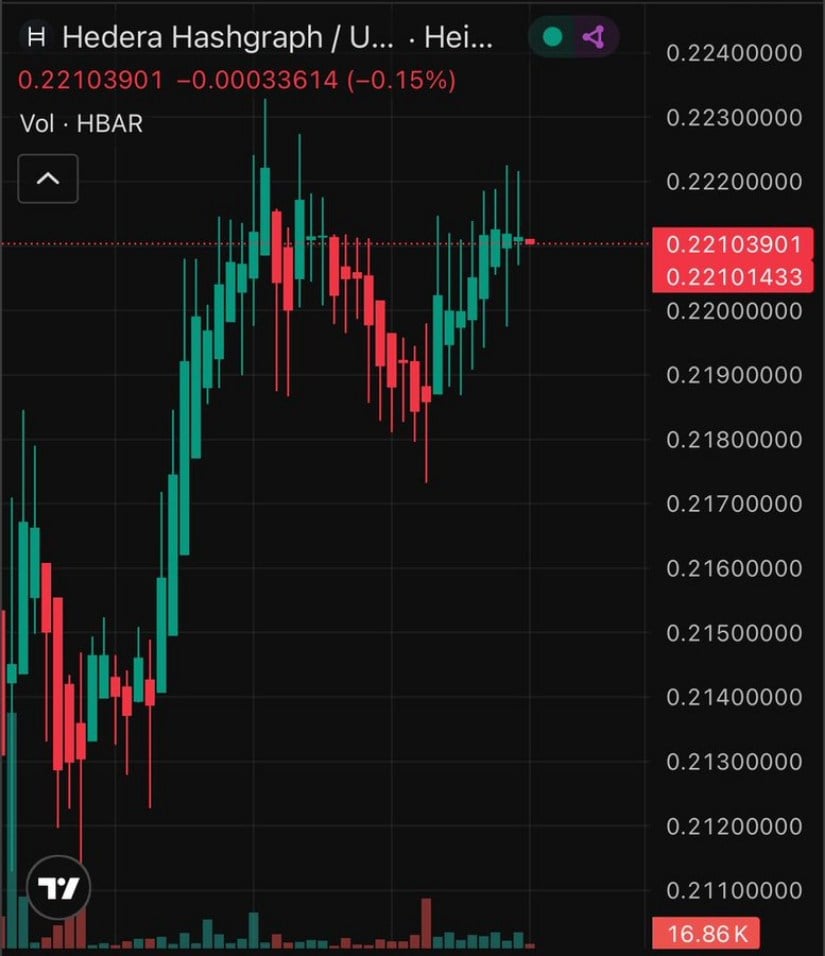
According to analyst Fresh, early buyers who entered the market at much lower price levels are continuing to accumulate HBAR Crypto steadily. The weekly chart shows the price hovering near $0.2210, just shy of the resistance at $0.2220.
A series of higher lows following a small dip near $0.2170 highlights the resilience of buyers. This steady demand is crucial; each minor pullback has been met with renewed support, indicating that the market is preparing for a potential breakout.
Source: X
If the asset can push past the $0.2220 resistance, the logical next target could be within the $0.2240–$0.2250 range. The volume doesn’t suggest frantic buying yet, but the steady accumulation fits the narrative of long-term holders positioning themselves before a push higher. However, should the price slip below $0.2200, some short-term profit-taking might occur, though the broader bullish trend remains intact as long as support near $0.2170 holds firm.
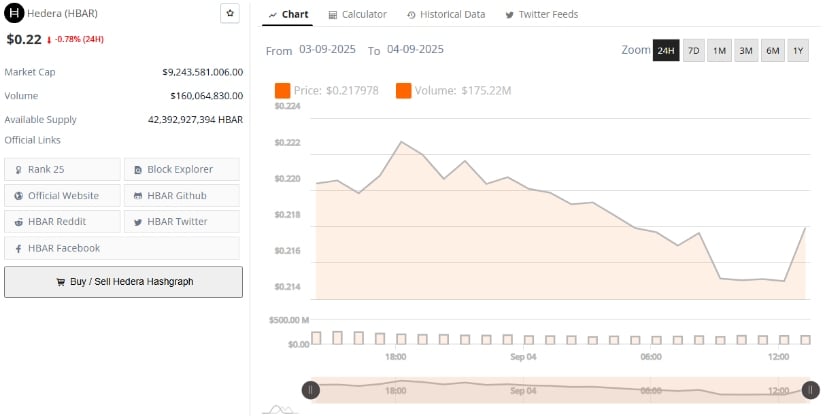
On one hand, BraveNewCoin’s recent data captures HBAR trading in a tight band between $0.214 and $0.222 over the last 24 hours, with the price dipping slightly by 0.78%. Despite the minor setback, the trading volume of $160 million signals active market participation. The market cap is hovering around $9.24 billion, maintaining robust investor interest.
Source: BraveNewCoin
Intraday price swings saw the memecoin briefly approach the upper band at $0.222 before retreating toward $0.216, revealing resistance near the top and solid support below.
The swift rebound off lows hints at underlying demand, yet the overall price movement reflects a cautious market waiting for a clear directional push. Sustained moves above $0.222 would carry important bullish implications, while slipping below $0.216 could open the door for further declines.
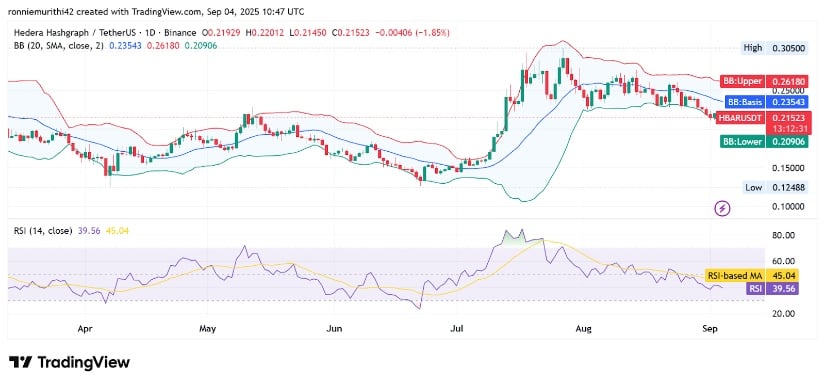
Looking at a broader perspective from April through early September, HBAR enjoyed a significant rally starting mid-July when it broke above the Bollinger Bands’ upper limit. This breakout launched a rapid surge in market capitalization to nearly $13 billion, fueled by strong buying pressure.
Source: TradingView
Since then, however, price momentum has slowed, with the market cap fluctuating and price nudging toward the Bollinger Bands’ lower band, signaling a correction or possible trend shift.
The Relative Strength Index (RSI) followed suit by moving from overbought levels near 80 down to the mid-30s, approaching oversold territory. This moderation in momentum suggests selling pressure is losing steam. Typically, such conditions can precede a period of stabilization or a renewed upward move as buyers step in again at attractive prices.

