TradingView data logged BTC at $75,265 at 05:23 UTC, pacing a nearly 3% daily gain after touching an intraday high of $75,700. The surge easily carried price action back above its key moving averages, with the 50-day, 100-day, and 200-day simple moving averages sitting near $64,500, $66,120, and $68,950, respectively.
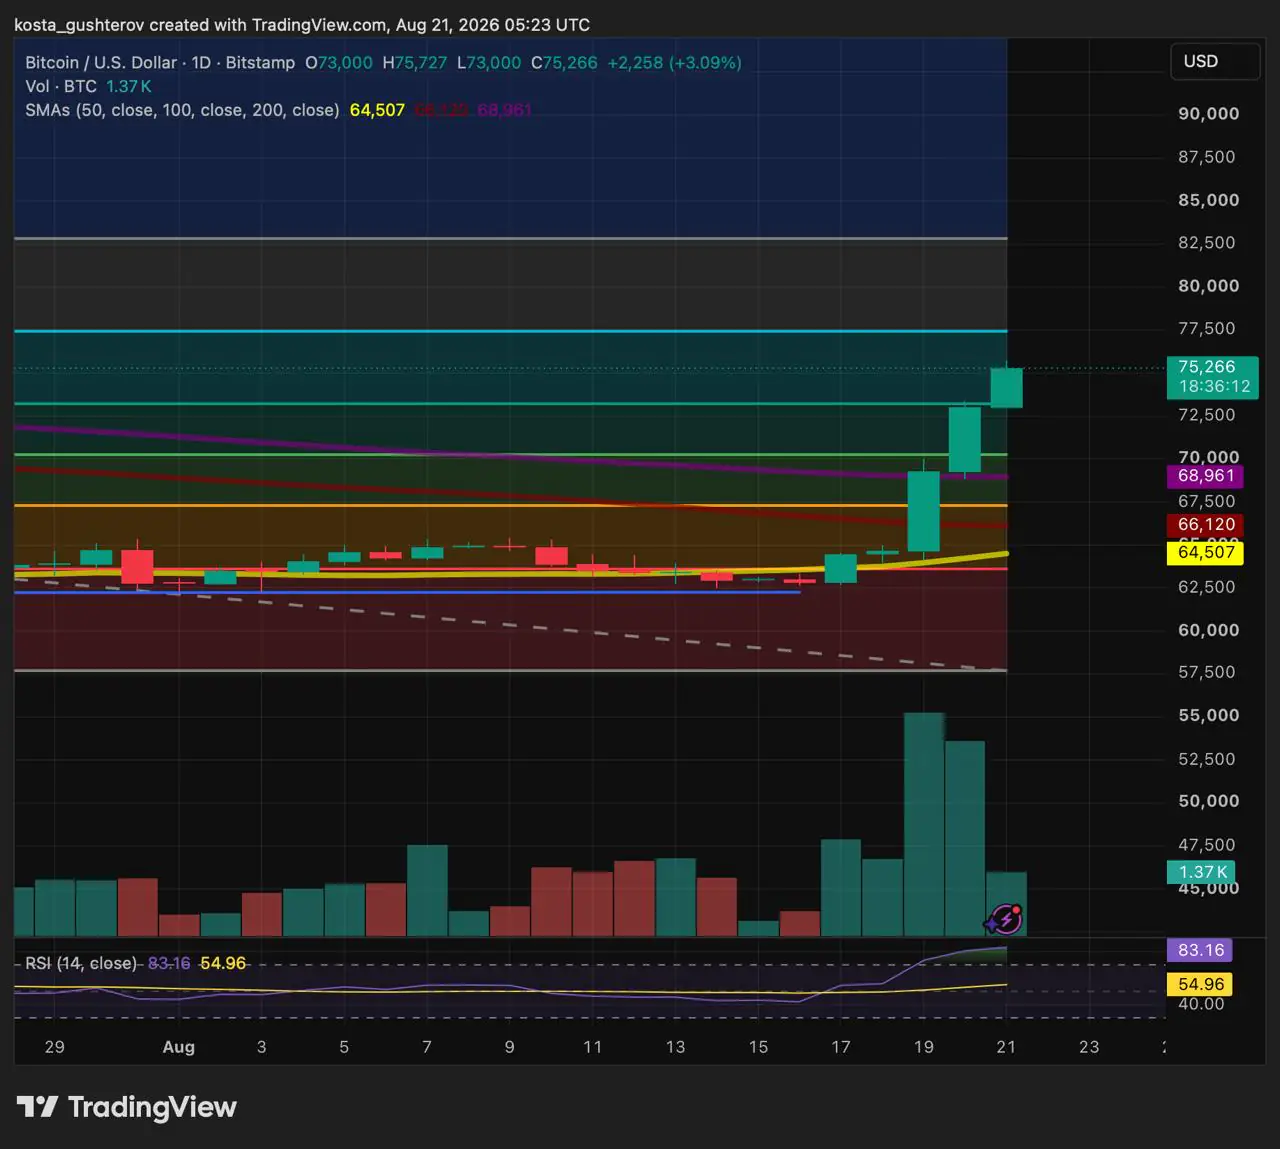
The breakout sliced cleanly through the 0.618 Fibonacci level at $73,210 which we highlighted as the closest resistance yesterday, calculated from the recent $57,700 swing low up to earlier highs. Having flipped that former ceiling into support, bulls now face the task of defending the level on a daily close.
A slip back under $73,210 would expose the move to a swift retracement. The initial safety nets below sit at $70,250 (the 0.5 Fibonacci level) and $67,280 (the 0.382 retracement).
Looking upward, the next clean barrier waits at the 0.786 retracement near $77,700. Clearing that wall clears a runway toward reclaiming the low-$80,000 region.
With the daily RSI screaming at 82.95, well past the traditional 70 overbought marker, momentum is officially red-hot. While overbought readings don’t guarantee an immediate cliff-dive, they heavily favor a cooling-off period or a retest of support before BTC makes its next run at $77,700.
Beneath the spot price action, the derivatives market experienced an aggressive squeeze. CoinGlass metrics highlight an enormous wave of liquidations, with short positions bearing the brunt of the damage.
Over a 12-hour window, total liquidations reached $382.26 million, of which a staggering $363.58 million belonged to liquidated shorts compared to just $18.68 million in long wipes. Looking across the broader 24-hour cycle, total rekt positions climbed to $793.99 million, fueled by $753.51 million in short liquidations against a mere $40.49 million in longs.
This massive imbalance reveals that the explosive drive past $75,000 wasn’t just organic spot buying; it was heavily accelerated by trapped bearish bets being forcefully closed out as the market surged.
Farside Investors’ Bitcoin ETF metrics captured roughly $103 million in net inflows for U.S. spot Bitcoin funds on August 20, following a massive $517.2 million haul on August 19.
While the data confirms uninterrupted institutional accumulation through regulated products, the velocity slowed down noticeably on the exact day Bitcoin extended its rally. That dynamic suggests the latest push was heavily driven by derivatives liquidations rather than a pure ETF squeeze; broader crypto positioning and market momentum shared the load.
The next U.S. trading session will provide a clearer read. Another heavy inflow day would signal that fund allocators are chasing the breakout higher, whereas a flip to net outflows would leave the short-term trajectory more dependent on active market traders.
Bitcoin’s broader recovery kicked off after the U.S. Treasury announced plans to at least double the maximum size of select long-dated bond buyback operations. That liquidity injection provided a tailwind for risk assets globally, while separate calls from Washington for Congress to prioritize crypto market structure added to the narrative.
While those macro developments established the runway for the broader trend, they aren’t fresh headlines driving this specific leg past $75,000.
The immediate test isn’t how fast BTC can chase $80,000, but whether it can successfully turn $73,200 into a concrete floor before challenging the next major wall at $77,700.
Source review: Price levels, moving averages, and RSI metrics stem from Bitstamp TradingView data captured at 05:23 UTC on August 21, 2026. Liquidation data is sourced from CoinGlass. ETF figures rely on Farside Investors reports, and macroeconomic background references the U.S. Treasury’s August 19 release. The article is provided for informational purposes only and does not constitute investment advice.
The post Bitcoin Rockets Past $75,000 as Bulls Defend Key Retracement Level appeared first on Coindoo.





