
Trading strategies provide a structured approach to participating in financial markets. They may help traders organise their decision-making process by using technical indicators, market patterns, and predefined rules. This article reviews five commonly used trading strategies and outlines how traders may apply them when developing their own approach to trading.
Trading strategies provide a structured approach for varying trading styles, which may help traders make decisions based on specific criteria and market conditions, rather than on intuition and guesswork. Here are some key types of trading strategies:
In trading, various indicators and patterns are utilised to analyse market conditions and identify potential entry and exit points. These tools can be broadly categorised into several groups, each serving a specific purpose across different trading strategies.
Trend indicators offer a way for traders to identify a trend’s direction and strength. Some popular trend indicators include:Moving Averages (Simple, Exponential)
Momentum indicators measure the speed and strength of price movements. They are used to identify overbought or oversold conditions. Common momentum indicators include:
Volatility indicators gauge the degree of price variation over time, providing insights into market turbulence. Key volatility indicators are:
Volume indicators analyse the trading volume to confirm the strength of a price movement or trend. Notable volume indicators include:
Reversal patterns signal potential changes in market direction, allowing traders to anticipate trend reversals. Some reversal patterns are:
Continuation patterns may help traders understand whether a current trend is likely to continue. Popular continuation patterns include:
Candlestick patterns are formed by one or more candlesticks on a chart and provide insights into market sentiment. Some candlestick patterns are:
These indicators and patterns form the foundation of many strategies, enabling traders to analyse market behaviour and make entry decisions. Below, we’ll use some of them in several different trading strategies.
Now, let’s examine five trading strategies that may work if you modify them in accordance with your trading plan and common trading rules. While we’ve used the EUR/USD pair to demonstrate the examples, they can also be applied as commodity, crypto*, and stock market trading strategies.
You can consider heading over to FXOpen’s TickTrader platform to access the indicators discussed in these strategies and more than 1,200 trading tools.
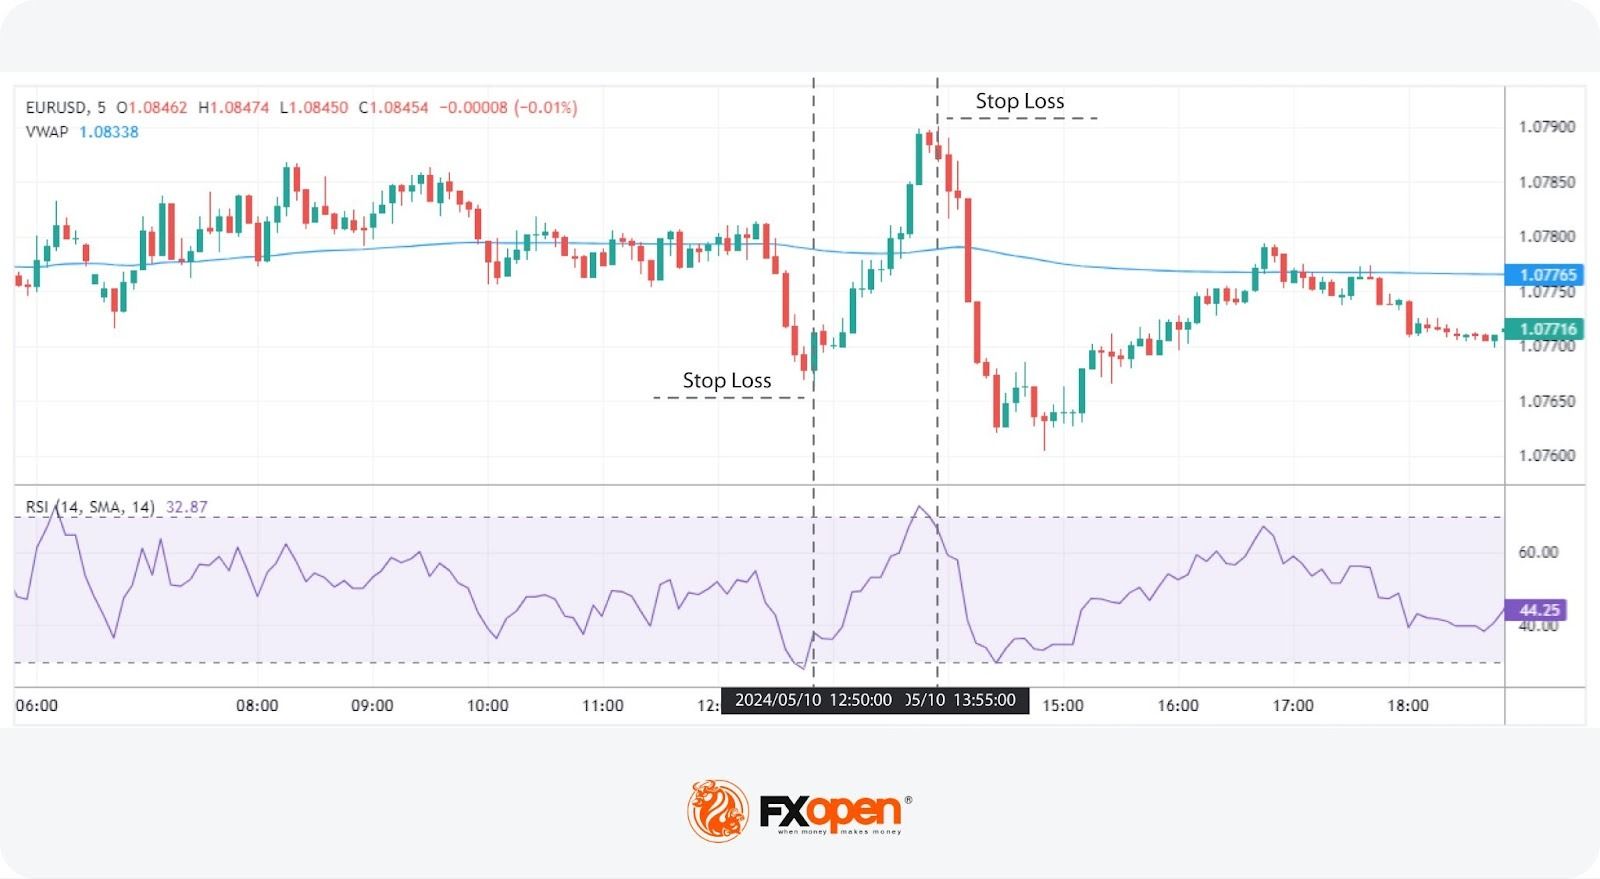
The VWAP and RSI trading method leverages mean reversion, which assumes that prices will revert to their mean value over time. This strategy combines VWAP’s price-volume insight with RSI’s momentum analysis, providing a clear picture of potential price reversals. According to theory, it’s usually used on intraday charts, typically the 5m or 15m, given the VWAP resets between trading days.
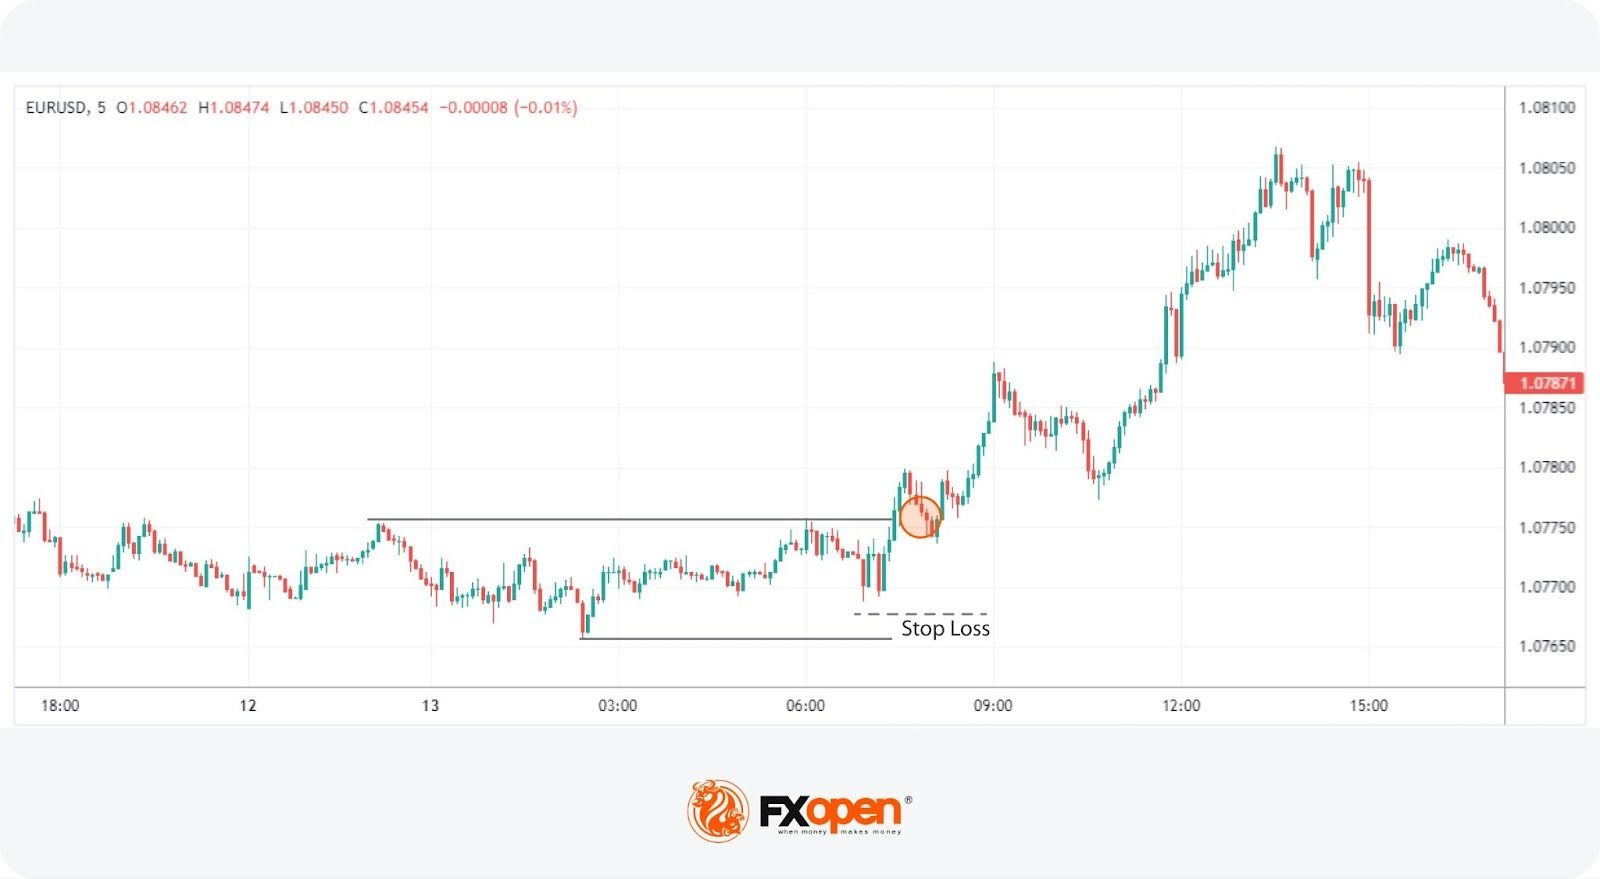
The Breakout and Retest trading technique focuses on identifying horizontal ranges or consolidation phases in the market. This strategy aims to take advantage of price movements that occur after the breakout of these ranges, leveraging the potential for substantial trend formation.
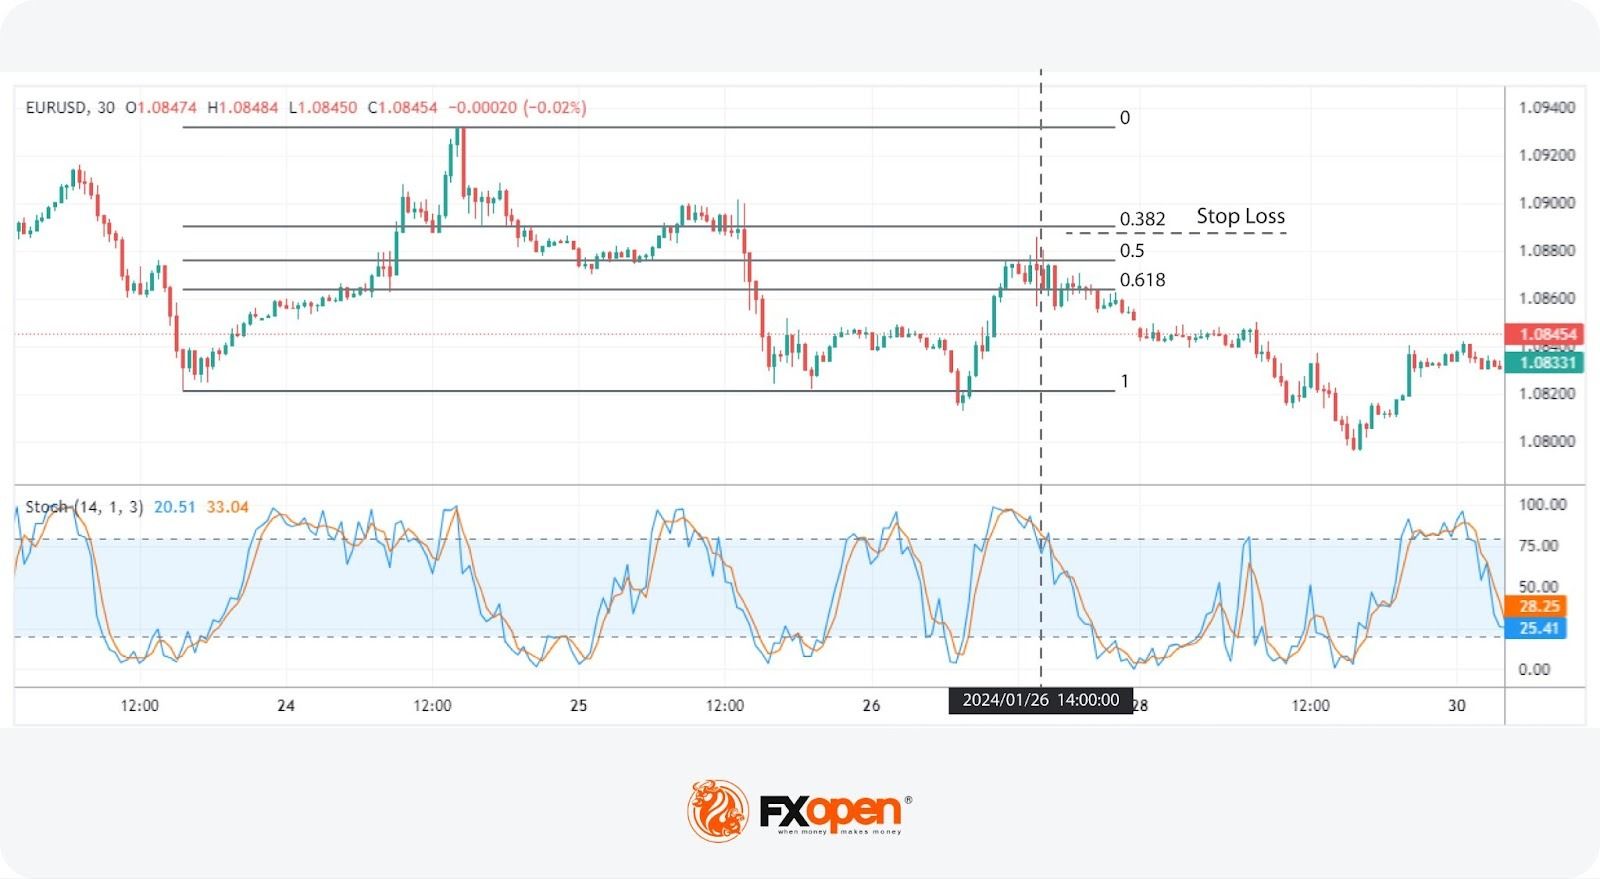
The Fibonacci and Stochastic strategy combines Fibonacci retracement levels with the Stochastic Oscillator to identify potential price reversals in trending markets. This approach leverages key retracement levels and momentum signals, offering traders a method for timing entries and exits.
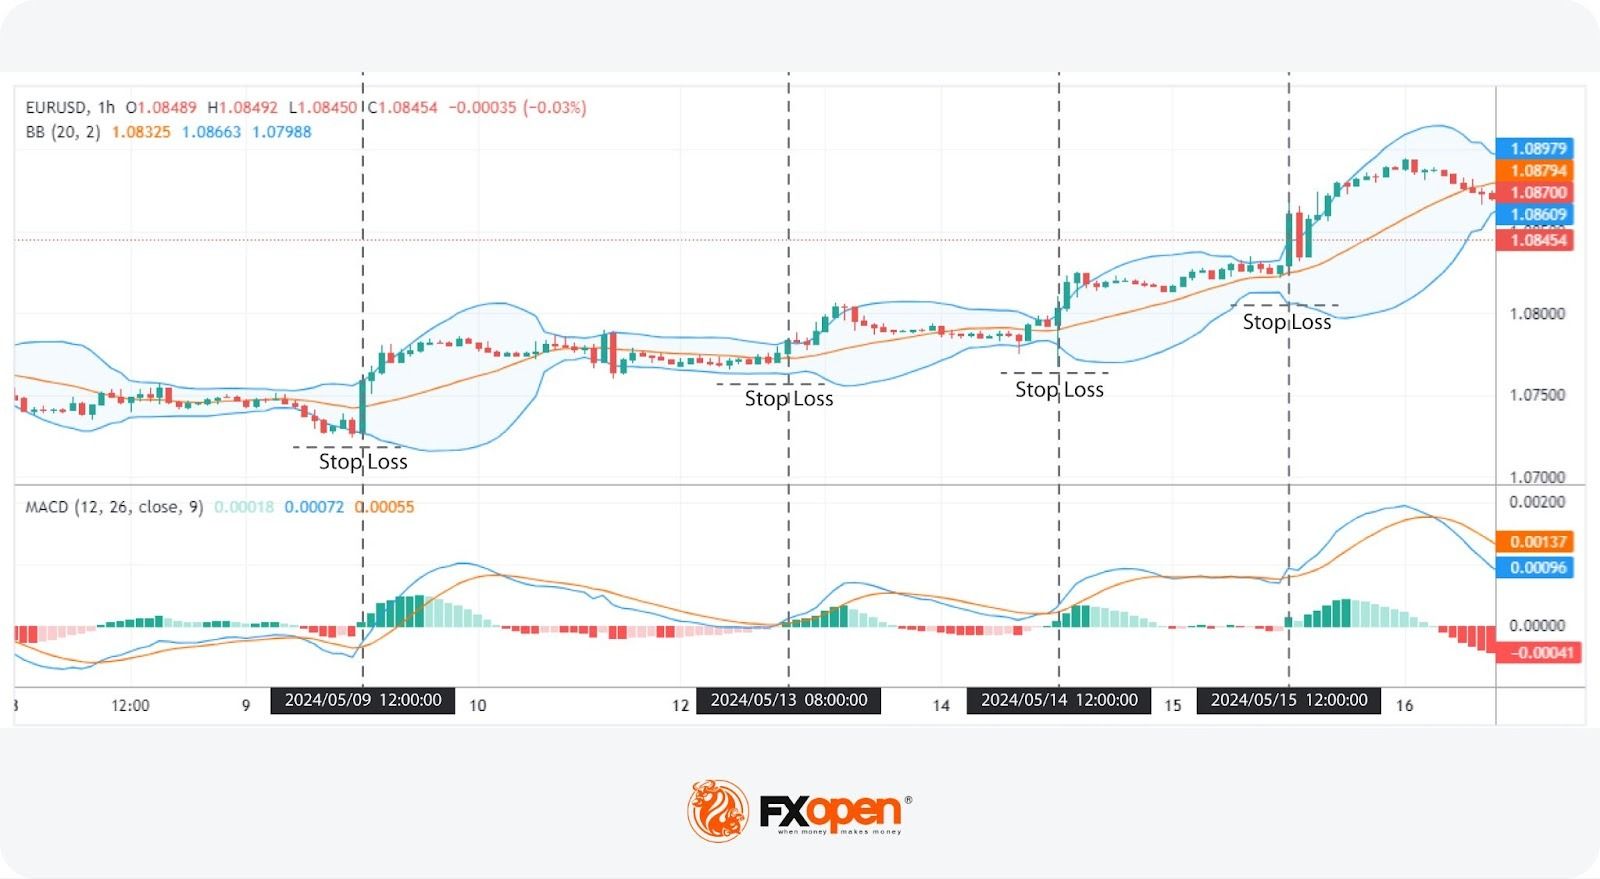
The Bollinger Band Squeeze and MACD strategy combines Bollinger Bands' volatility analysis with MACD's momentum confirmation. This approach identifies potential breakouts above/below the Bollinger band following periods of low volatility, providing a robust framework for trading such events. The strategy is used in a solid trend and in the direction of the trend.
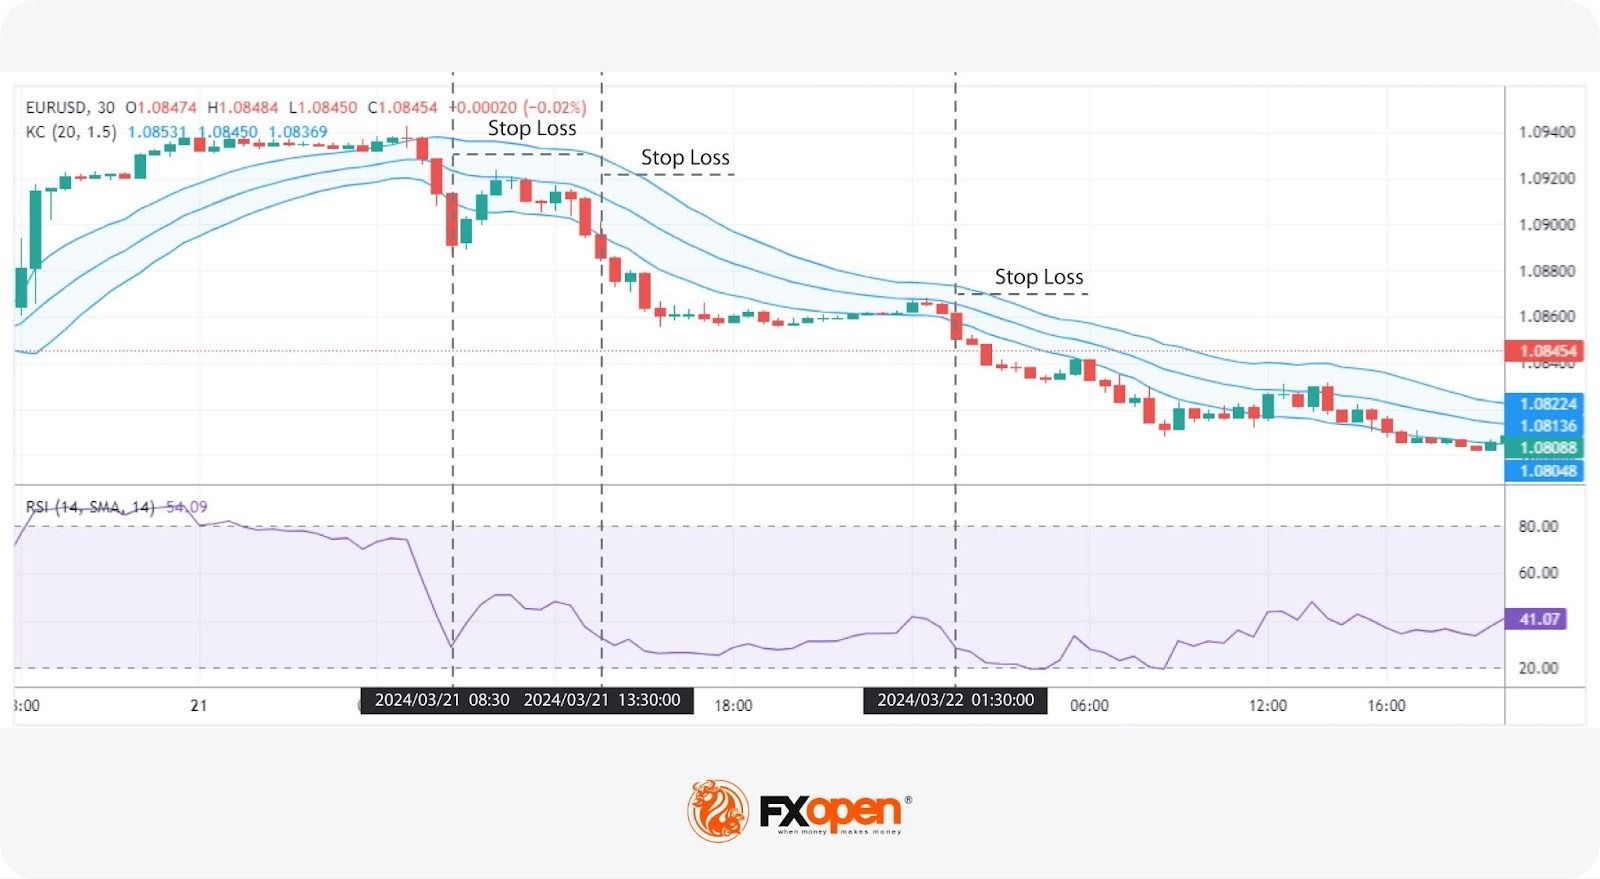
The Keltner Channel and RSI Momentum strategy leverages volatility and momentum to identify potential entry points. This approach focuses on price movements outside the Keltner Channel, confirmed by RSI. The strategy is applied within the strong trend.
Understanding and applying different trading strategies allows traders to develop a more structured and consistent approach to market participation. Each strategy offers a different perspective on price behaviour and market dynamics, making it important to consider how they align with individual trading styles, time horizons, and risk preferences.
FXOpen provides access to over 1,200 tools and supports a range of trading approaches within a trading environment. You can consider opening an FXOpen account and gain access to 4 trading platforms, tight spreads*, and low commissions* (*additional fees may apply).
The most basic trading strategy is the moving average golden and death cross strategy. This approach involves using two moving averages, typically 50-day and 200-day, to identify buy and sell signals. A golden cross occurs when the short-term 50-day moving average crosses above the long-term 200-day moving average, signalling a bullish market trend. Conversely, a death cross happens when the 50-day moving average crosses below the 200-day moving average, indicating a bearish trend.
According to theory, day traders use momentum trading. This strategy involves identifying assets that are moving significantly in one direction on high volume. In a stock trading strategy, for instance, a day trader might buy a stock climbing strongly backed by higher-than-average volume. They might rely on technical indicators like Moving Average Convergence Divergence (MACD) and Relative Strength Index (RSI) to make decisions.
To backtest a trading strategy, traders use historical data to simulate the performance of a strategy over a specified period. This involves applying the strategy's rules to past data to see how it would have performed. Traders typically use backtesting software or platforms that allow for detailed analysis and visualisation of results.
Creating a trading strategy involves several steps. First, traders identify their trading goals and risk tolerance. Then, they choose the market and timeframe they want to trade. After that, they develop specific entry and exit rules using technical indicators and patterns. Finally, traders test their strategy using historical data to ensure it works more often than it fails before applying it to live trading. Also, ChatGPT is widely used by traders to create trading strategies. You can read our article ‘How to Use ChatGPT to Make Trading Strategies.’
*Important: At FXOpen UK, Cryptocurrency trading via CFDs is only available to our Professional clients. They are not available for trading by Retail clients. To find out more information about how this may affect you, please get in touch with our team.

