
Have you ever seen prices suddenly spike beyond a key level, only to sharply reverse? That may have been a liquidity grab, one of the major components of Smart Money trading. Understanding this concept may help traders anticipate where price may go next. In this article, we explore what liquidity grabs are, how to detect them, and how they may fit into a trading strategy.
Liquidity is about the ability to buy or sell an asset without causing a sharp price movement. High liquidity is characterised by a dense presence of buyers and sellers, resulting in tight spreads—the small difference between ask and bid prices—and potentially smoother price movements. Conversely, low liquidity involves fewer participants and wider spreads, leading to potentially abrupt price changes even with small trades.
The level of liquidity can vary dramatically depending on several factors, including the time of day, prevailing market events, and specific price levels. For example, major currency pairs like EUR/USD experience higher liquidity during overlapping trading hours between New York and London markets, facilitating smoother transactions.
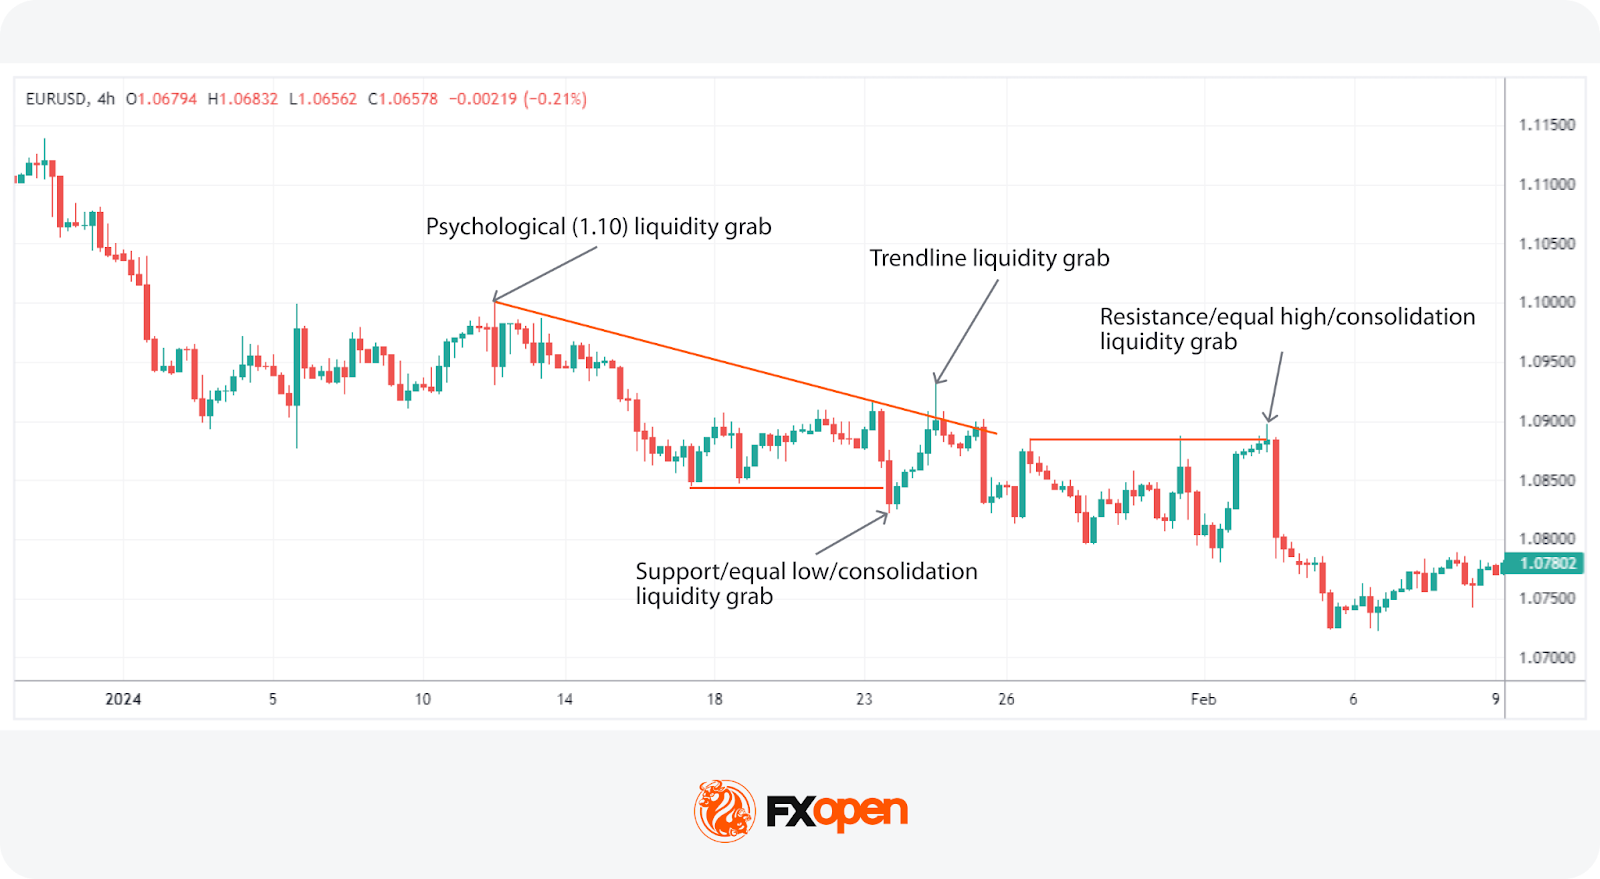
Similarly, liquidity can be at its highest around significant price levels due to historical pricing (e.g., a support/resistance level), levels of a particular pattern, or institutional interest, which attract increased trading activity. During major economic announcements or geopolitical events, liquidity can also fluctuate wildly.
A liquidity grab, sometimes known as a stop hunt or bull/bear trap, is a concept that describes a scenario with a rapid and substantial movement in an asset's price due to the execution of a large volume of orders at a specific price level. This movement often occurs at stop-loss orders. When the orders are triggered simultaneously, they can cause sharp price spikes or drops, temporarily distorting the market prices.
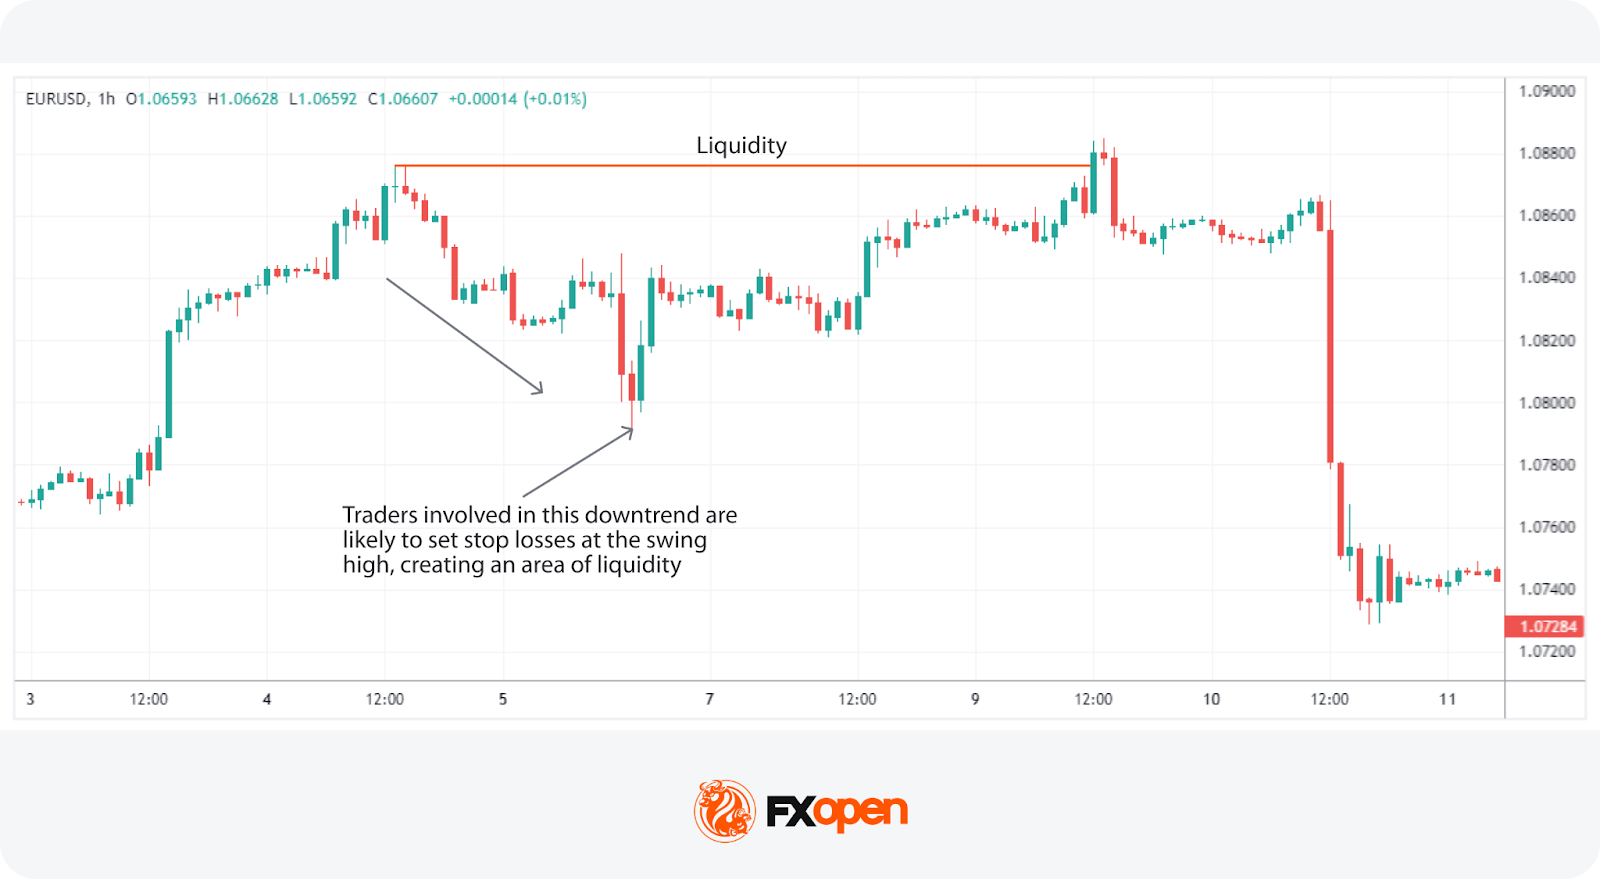
Typically, liquidity grabs occur in areas where traders expect significant resistance or support—points on price charts that historically have reversed or stalled price movements. They often align with psychological price levels, such as round numbers (e.g., 1.3000 in forex trading) or historical highs and lows, which are watched closely by market participants. Traders might also target the price points just beyond swing highs and lows to close their positions, which can compound the effect of a liquidity grab.
During a stop hunt, the sudden price movement happens when large traders or institutional players intentionally push the price to these sensitive levels to trigger clustered stop-loss orders. Such action may allow large traders to enter or exit positions at attractive prices, essentially 'grabbing' the available liquidity.
In the Smart Money framework, liquidity grabs are seen as strategic moves used by institutional traders to execute sizable orders with minimal market impact. These traders target zones where liquidity is high, typically around levels crowded with stop-loss orders and areas where traders are poised to enter on a breakout. High liquidity is thought to mean that executing a large order causes less price slippage, allowing them to secure more favourable prices.
For example, if a large trader aims to establish a significant short position on a currency, they might look for a liquidity zone filled with buy orders—such as those placed for stopping losses on short positions or initiating long positions on a breakout. By targeting these areas, the trader can fill their large order against existing buy orders rather than dispersing the order across various price points in the order book, which would typically result in greater slippage and less favourable execution.
Areas with concentrated liquidity might be used for identifying entry and exit points.
To see how liquidity grabs unfold in these areas, you can consider heading over to FXOpen’s TickTrader platform to access real-time charts.
So, how do traders typically identify liquidity grabs?
It’s worth remembering that a liquidity grab is a temporary retreat of the price, and it can signal both trend continuation and reversal. This underscores the importance of integrating this concept with other analytical tools and waiting for additional confirmation before making trading decisions.
Some traders choose to place wider stop losses to avoid liquidity grabs. However, larger stop-loss levels may result in a less favourable risk/reward ratio.
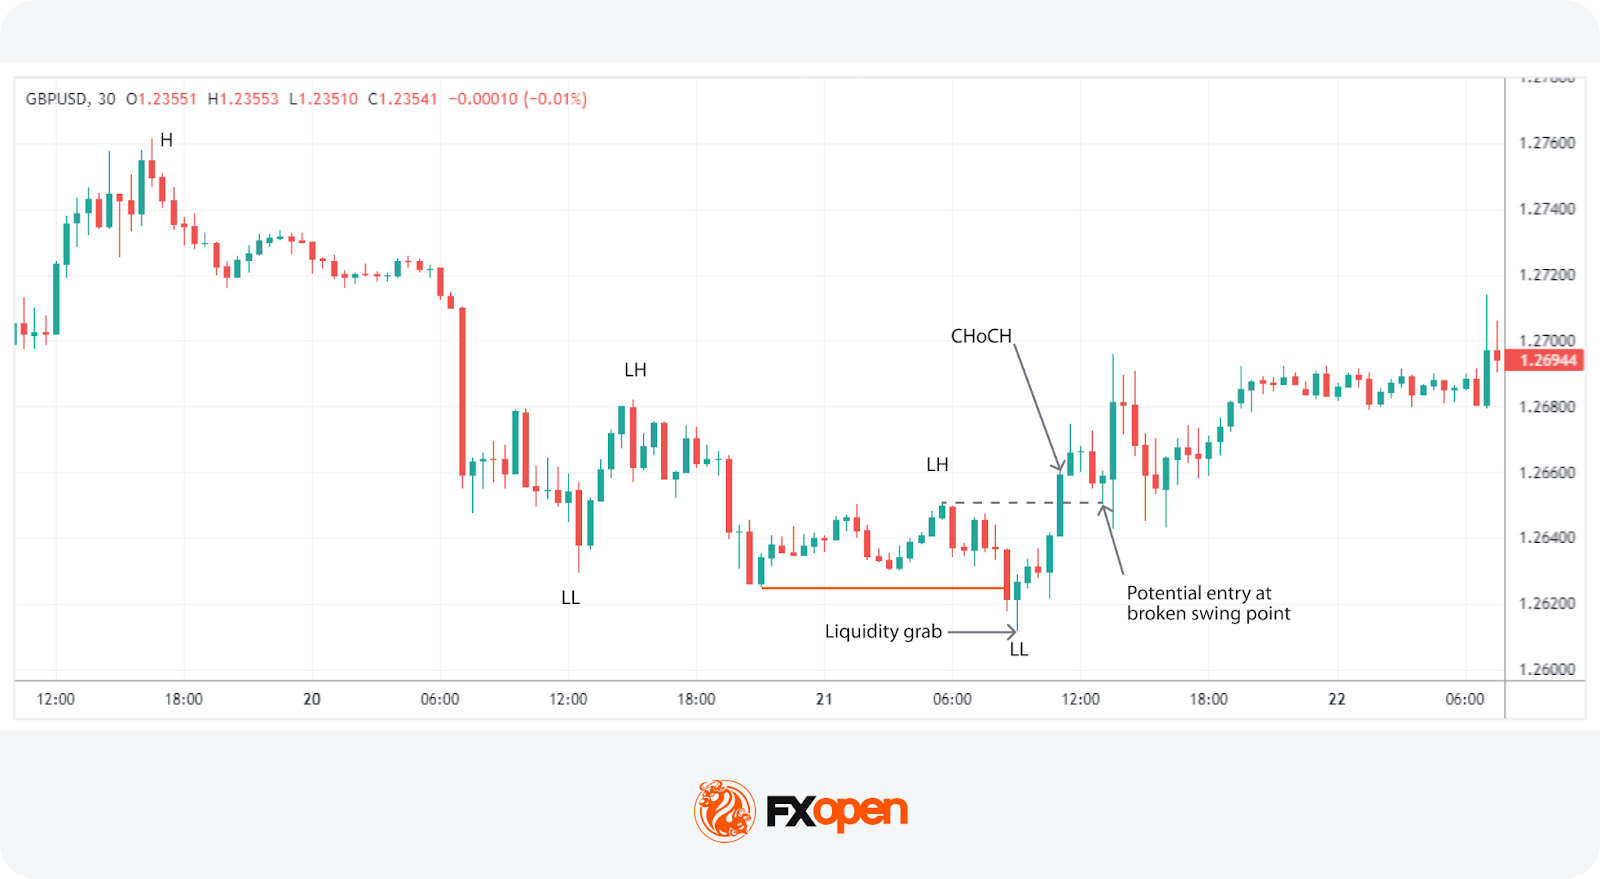
To build a liquidity grab strategy, traders often utilise the concept of a Change of Character (CHoCH) to find confirmation and an entry point. A Change of Character is a shift in the prevailing trend pattern. For example, in a bearish trend characterised by lower highs and lower lows, a CHoCH occurs when the trend fails to maintain the pattern and produces a higher high, indicating a potential reversal.
When a liquidity grab occurs, it should ideally prompt a CHoCH. This is seen when, after a liquidity grab (often manifesting as a quick spike into key liquidity areas followed by a sharp reversal), the market breaks the pattern of the prevailing trend. Such a break is a critical confirmation sign that the grab is likely leading to a trend reversal.
Once a liquidity grab paired with a CHoCH is identified, a trader can look for strategic entry points. Traders may:
The theory states setting stop losses just beyond the high or low of the grab is common. This positioning assumes that if the market revisits these extremes, the initial analysis of the reversal may no longer be valid.
Liquidity grabs can provide valuable insight into where institutional players may be entering the market. By recognising price sweeps around key levels and understanding their context within a broader market structure, traders can anticipate potential reversals or continuations. While not every liquidity grab leads to a favourable setup, combining this concept with proper risk management and confirmation tools can turn it into a powerful part of a trading strategy.
If you are looking to apply these insights in real-time trading, you can consider opening an FXOpen account and gain access to tight spreads and low commissions.
A liquidity grab occurs when the price briefly moves beyond a key support or resistance level to trigger stop-loss orders or attract breakout traders, allowing larger market participants to fill their positions at more attractive prices. Once liquidity is collected from these orders, the price often reverses sharply in the opposite direction. The theory states that large traders or institutions exploit accumulated stop-loss orders to move the market in their favour briefly.
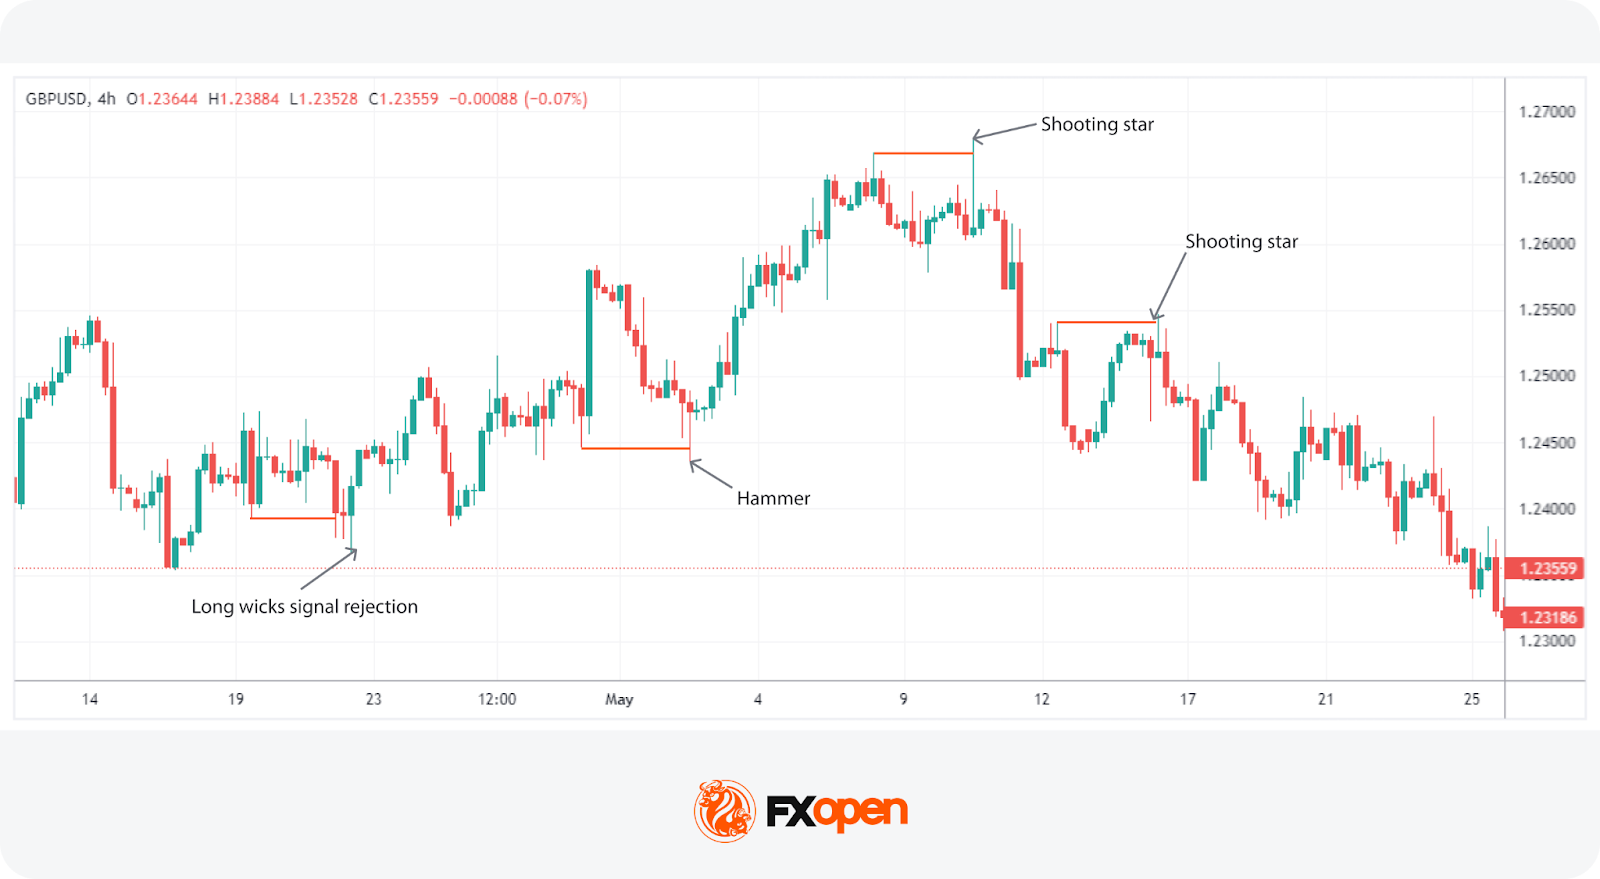
Liquidity grabs can be identified by watching for rapid movements into and out of liquidity-rich areas, followed by quick price retractions. These are often marked by specific candlestick patterns, like hammers or shooting stars, or several candles with long wicks that indicate sharp rejections.
Trading liquidity grabs involves understanding the underlying market structure and identifying potential reversal points after a grab. Traders typically look for entries at key retracement levels or gaps following a grab and signs of a reversal, setting stop losses just outside the extreme points of the liquidity event.
While a liquidity grab is about exploiting clustered stop-loss orders, a break of structure occurs when a trend continues by surpassing a previous major high or low.

