
Uniswap (UNI) has spent nearly four years in a prolonged accumulation phase, according to analyst Osemka, who highlighted the pattern.
The higher timeframe formation is similar to a classic Wyckoff accumulation formation. Past versions of this formation have started off with a rapid sell-off, followed by a long period of consolidative price action.
This is characteristic of a price moving from distribution to accumulation. The key levels of this formation, Preliminary Support, Selling Climax, Automatic Rally, and Secondary Test, demonstrate that panic selling is being digested and professional buyers are buying.
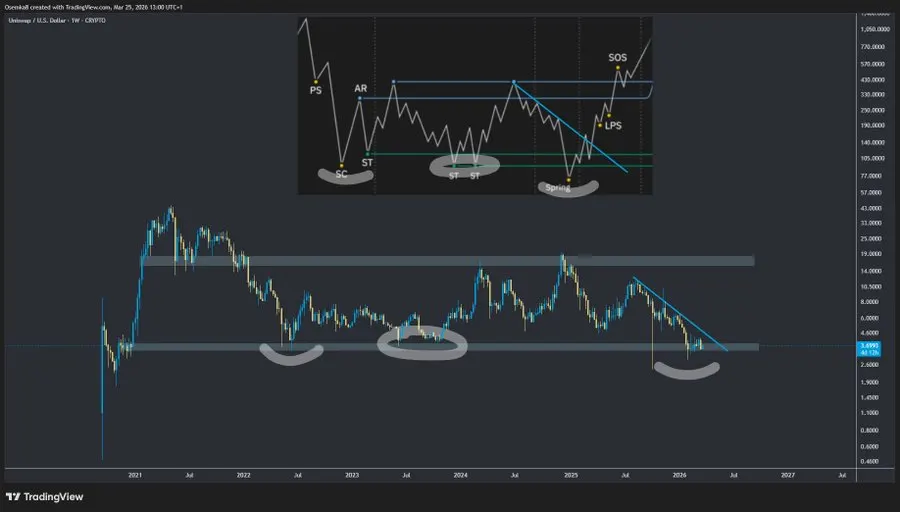
Source: X
UNI repeatedly tested its lower supports between 2022 and 2024, with mid-range resistance continuing to cap its price rise. This pattern displays equal lows and rounded bases, indicating a gradual build-up of liquidity.
Recently, a minor dip below support has resembled a Spring, a Wyckoff pattern where late selling is trapped as prices advance. Preliminary data points to UNI’s Last Point of Support, which may result in higher lows and eventually challenge the range highs.
Also Read: Uniswap (UNI) Flashes Ascending Triangle: Is a 30% Price Move Next?
TradingView’s analysis on March 26 shows that UNI/USDT is in a downtrend on a weekly chart following a failed attempt to bounce back at prices within the range of $10 to $12. UNI/USDT rose to about $12.27 before declining to lower highs and lower lows.
However, a sharp decline to about $2.32 may have been due to panic selling or large liquidity transactions. After this decline, UNI/USDT stabilized at $3.40 to $3.50.
UNI is currently trading below all major MAs (20, 50, 100, 200). The first resistance for UNI comes from its 20 EMA, which is currently trading at $4.73. The 50 EMA for UNI is trading at $6.18, and the 200 EMA is trading at $8.90. This supports the bearish view that the market is nowhere near balance.
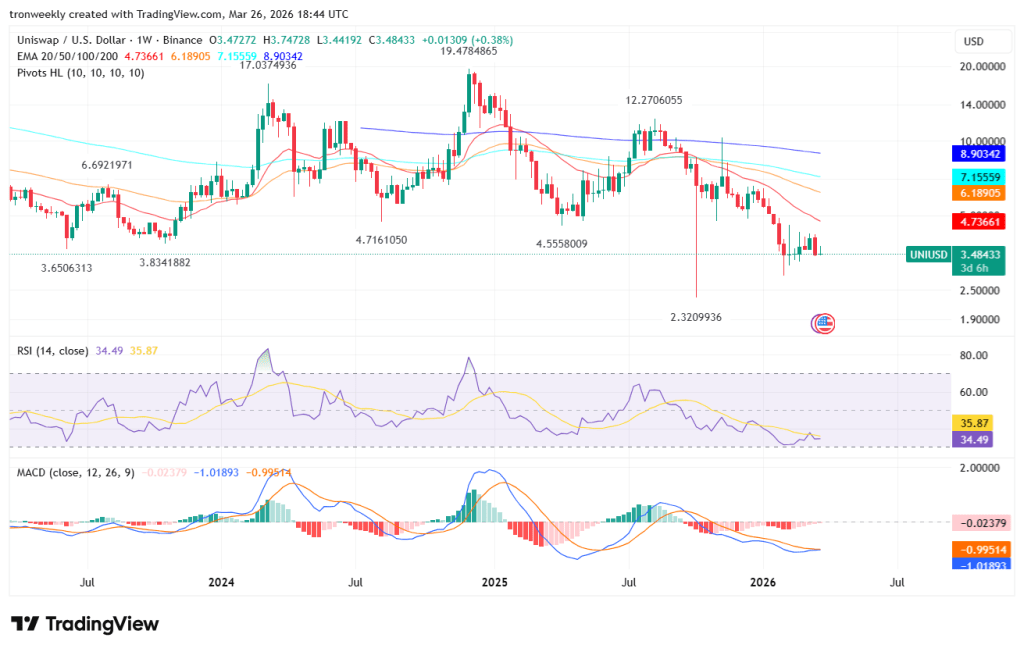
Source: TradingView
The momentum indicators, such as UNI’s RSI, which is at 34-35 and its MACD trading negatively, show that selling pressure is decreasing but has not turned positive.
Support levels of $3.00 to $2.30 are still relevant. If this price is broken through, another fall is possible. If it can be taken back up through levels of $4.70 to $5.00, that is the first indication of strength.
Going through $6.00 is likely necessary for the short-term trend to be considered bullish. Until there is a clear breakout, the market is mixed. The long-term outlook is positive for upward movement, but until then, the short-term is still controlled by bears.
This article contains market analysis and price predictions. These are not guarantees. Crypto markets are volatile. Always DYOR. Not financial advice.
Also Read: Uniswap (UNI) Eyes $5.30 Rally If $4.10 Breakout Holds Firm


