
VeChain (VET) is moving in an upward consolidation phase with a breakout in sight as the token is moving in a descending channel. According to CoinMarketCap, the VET price has surged by 1.4% over the last 24 hours but remains stable over the last week.
At the time of writing, VET is trading at $0.007327 with a trading volume of $20.97 million, which has declined by 10.82% over the last 24 hours. However, its market capitalization stands at $630.09 million, which is up by 1.4%.
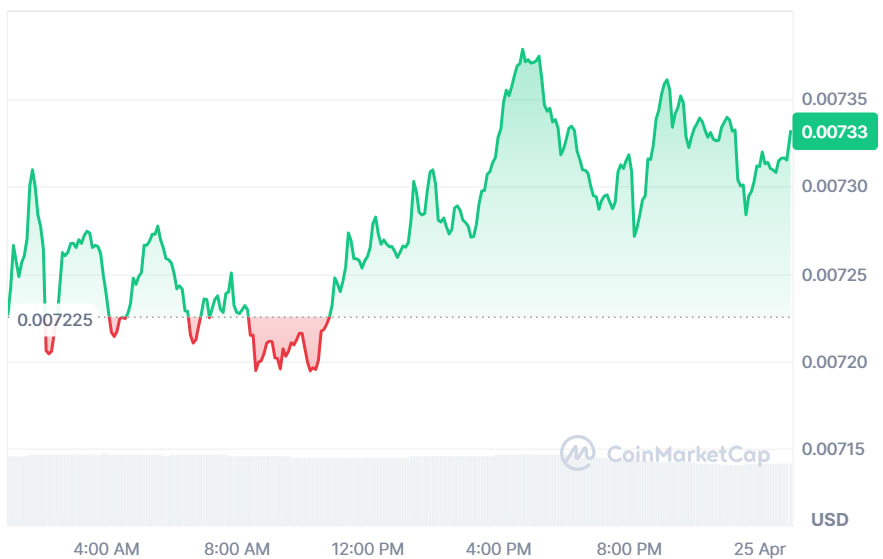
Source: CoinMarketCap
Also Read: VeChain (VET) Eyes $0.02 Rally After Descending Trendline Breakout
Furthermore, the crypto analyst Butterfly highlighted that VET is currently trading within a descending channel on the 2-week timeframe, a structure often linked to prolonged consolidation phases.
While price continues forming lower highs and lows, analysts suggest this could reflect accumulation rather than weakness, with buyers gradually absorbing supply as selling pressure diminishes over time.

Source: Butterfly’s X Post
In case of continued buildup, VET will at some point try to make a breakout towards the upside in an attempt to break out from the resistance level.
Price forecasts indicate that one possible target for the breakout is around the $0.080 level. On the other hand, the lack of breakout would only result in further consolidation.
According to TradingView, the consolidation phase is evident in VET, which follows its mid-month upward trend. At present, it trades at $0.00676.
The price movements exhibit a bullish pattern, as evidenced by the candlesticks being above the 20, 50, 100, and 200 EMA levels. This indicates stable support as the coin maintains a favorable outlook amid its previous test at $0.00680.
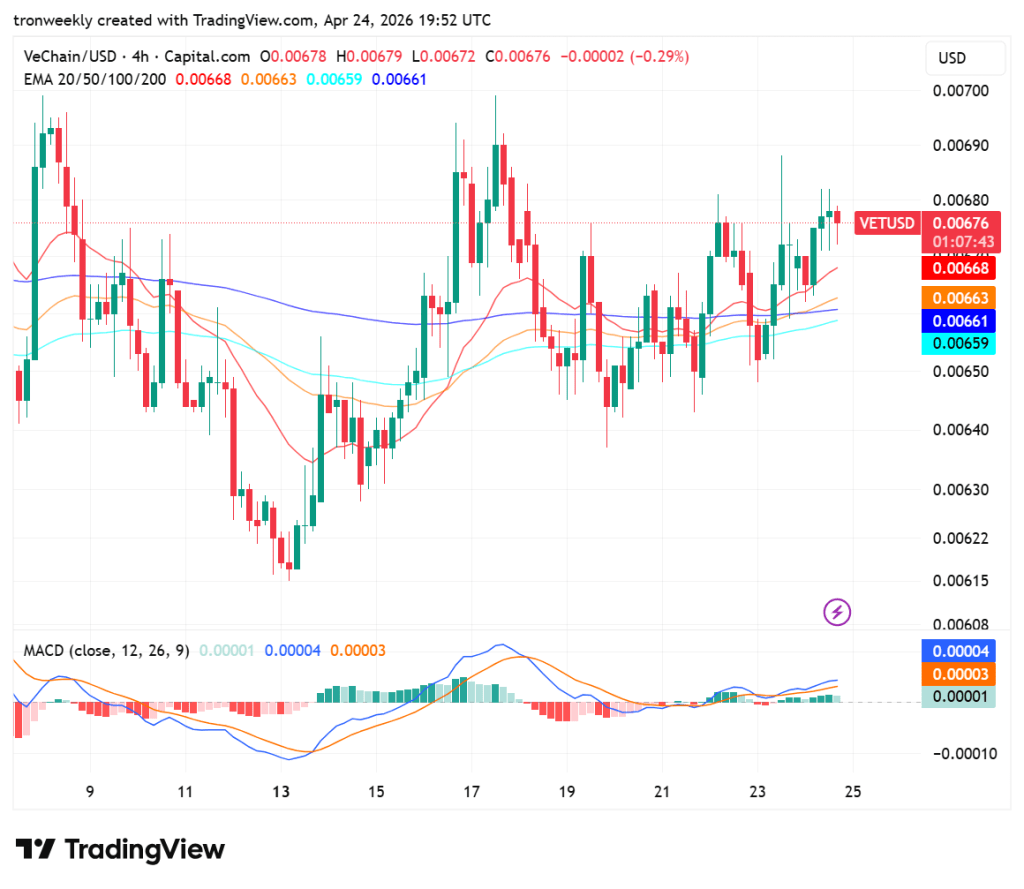
Source: TradingView
Despite the price, the MACD shows that the environment is stable, where the MACD line and the signal line are increasing in a positive direction just above the zero line.
The histogram bars are also low and positive, indicating that although there isn’t any powerful momentum in the current trend, buying power still dominates selling power in this market environment.
This article contains market analysis and price predictions. These are not guarantees. Crypto markets are volatile. Always DYOR. Not financial advice.
Also Read: VeChain (VET) Sets Sights on $0.02 Rally Following Key Trendline Breakout

