
Virtuals Protocol (VIRTUAL) is retesting the lower boundary of its trading channel on Friday, March 6, placing a key support zone in focus. The crypto analyst Crypto Pulse notes that if buyers successfully defend this level, the token could stage a recovery rally.
A sustained bounce from the channel support may push VIRTUAL back toward the $0.80 region, restoring short-term bullish momentum.
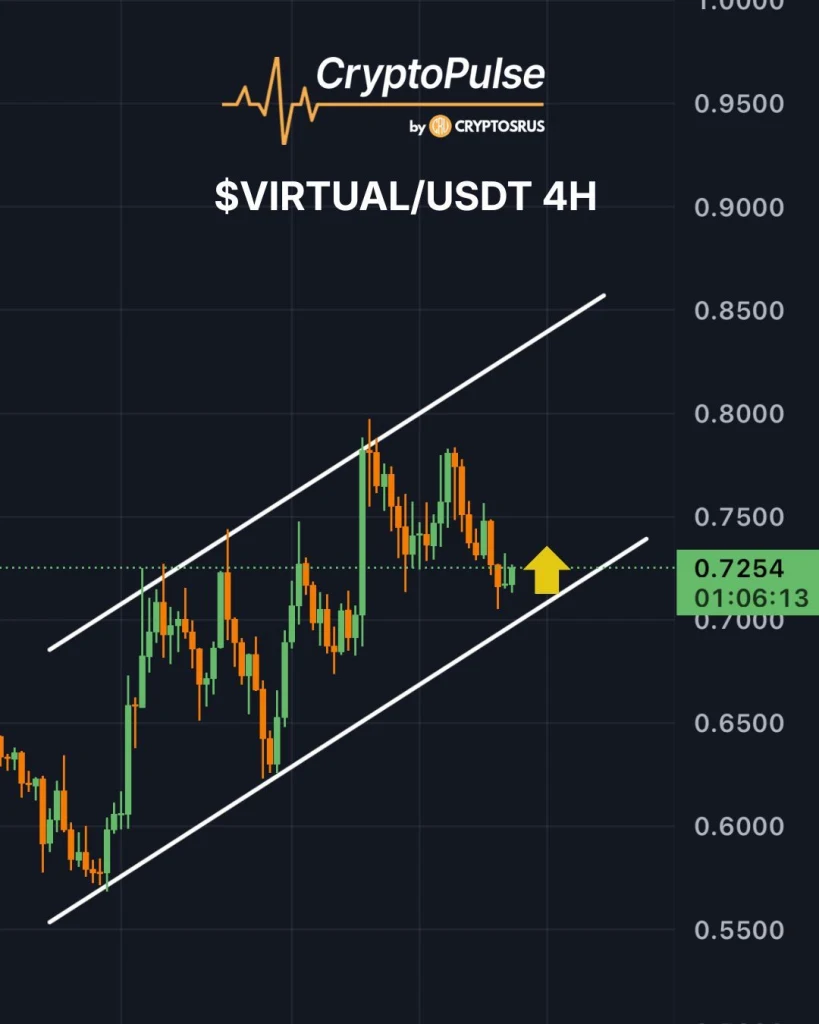
Scrypto Crypto Pulse’s X Post
However, the bullish outlook depends on support near $0.67 holding firm. Market watchers warn that a confirmed candle close below this level would invalidate the current setup and signal growing selling pressure.
Such a breakdown could shift sentiment bearish, potentially triggering a deeper correction as traders reassess VIRTUAL’s near-term market direction.
Also Read: Virtuals Protocol (VIRTUAL) Eyes $0.65 Breakout Amid Bearish Pressure
According to TradingView, as of Friday, March 6, VIRTUAL is displaying a market that is trying to stabilize from a long-term downtrend, which began at the end of 2025.
The price movement is defined by lower highs and lower lows, causing the asset to remain below major EMAs. Interestingly, the asset is also facing resistance from the 200-Day EMA and the 100-Day EMA.
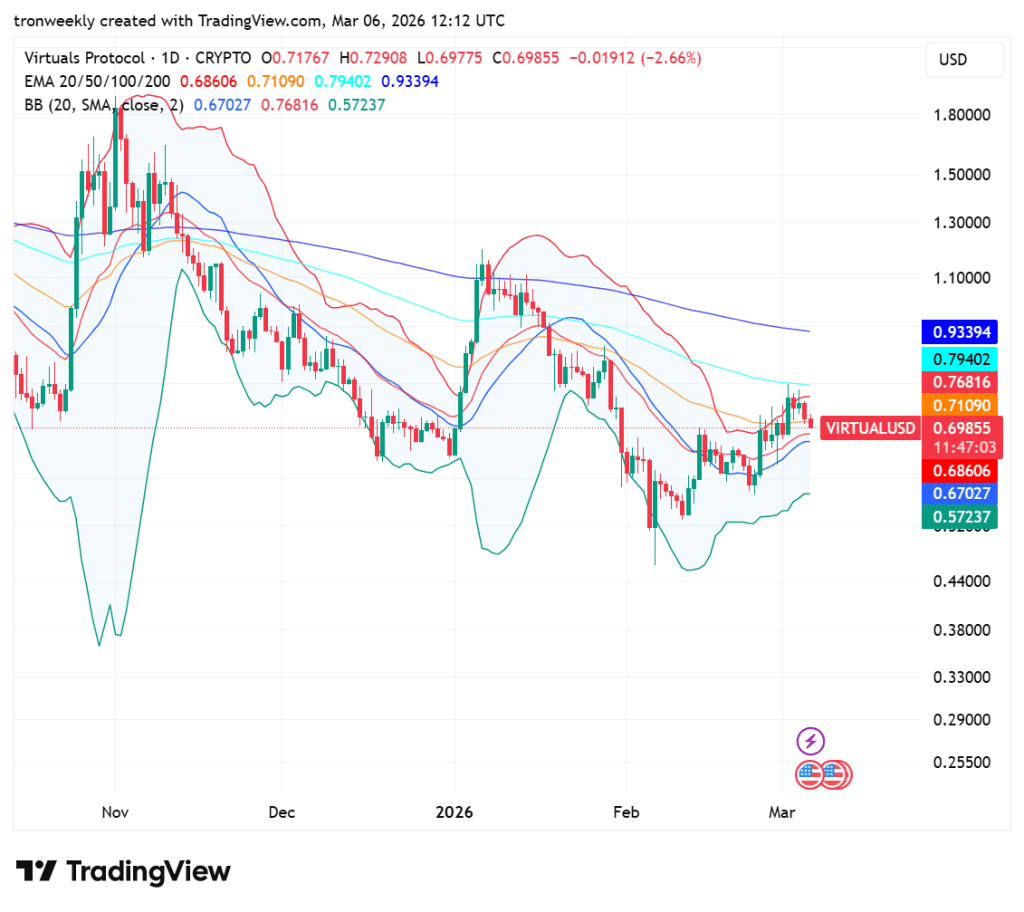
Source: TradingView
From a volatility perspective, the Bollinger Bands are starting to contract, and this is usually a precursor to a major breakout in price.
The price is currently trading in the upper half of the price range, stuck between the middle orange band at $0.67027 and the upper band. Although the price is slightly biased to the upside, the overall trend is quite bearish.
The RSI (14) is currently at 52.14, which indicates that the market is in a neutral position. It is right in the middle of the overbought and oversold regions, indicating that the price is currently stuck.
It is also closely following its signal average, which indicates that the price is currently undergoing horizontal consolidation. Traders are probably waiting for the breakout to enter new positions.
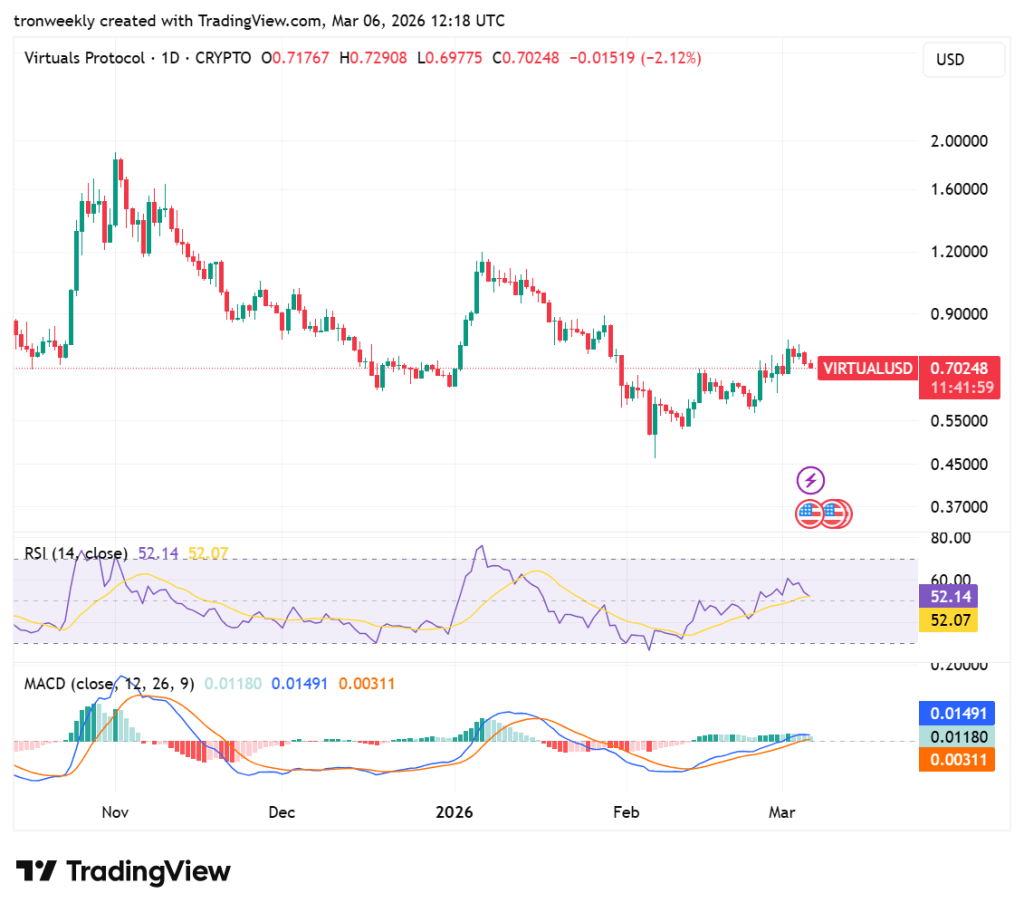
Source: TradingView
The MACD is also showing a slight bullish indication with the blue line remaining above the orange line. The histogram is also showing small green bars, but the height is very small, suggesting that the strength is low.
The fact that the lines are close to the zero point also suggests that the trend is highly indecisive at the moment.
Also Read: VIRTUAL Eyes $0.75 Breakout Amid Strong Momentum and Buying Pressure

