Spotting market reversals early is one of the most valuable skills a trader can develop. Candlestick patterns may provide a clear visual representation of price dynamics, which may help identify shifts in sentiment before they fully unfold. When applied correctly, they can serve as important parts of trading strategies.
This article examines 10 candlestick reversal patterns that experienced traders rely on to navigate both bullish and bearish turning points.
Reversal candlesticks are important formations in technical analysis that signal a potential shift in the direction of an asset’s price. These patterns are observed within candlestick charts, where each "candle" reflects the opening, closing, high, and low prices for a specific period. Reversal patterns suggest that the current trend, whether upward or downward, may be losing momentum, providing a signal for traders to enter or exit the market before the trend reverses.
Reversal candlestick patterns come in both bullish and bearish forms. A bullish reversal indicates the potential end of a downward trend and the beginning of an upward movement, while a bearish reversal suggests the end of an uptrend and the start of a downtrend. Some common reversal patterns include the hammer, shooting star, engulfing candles, and three black crows or three white soldiers.
These formations are essential for traders aiming to foresee trend shifts in markets, but they should always be confirmed by other technical indicators for increased accuracy.
Traders use reversal candles as part of a broader strategy to time their market entries and exits. When a pattern forms, traders typically wait for additional confirmation—such as subsequent candles or supporting indicators—before making a move. For instance, if a trader spots a bullish hammer, they may wait for the next candle to close higher before entering a long position.
Similarly, traders set stop-loss levels based on the pattern's structure. For example, in the case of engulfing candlesticks, a stop loss might be placed just below the low of the bullish engulfing candle. This strategy may help potentially manage risk if the reversal does not fully materialise.
There are many reversal formations, but some are more frequently used than others. We look at five common bullish and bearish candlestick reversal patterns to be aware of.
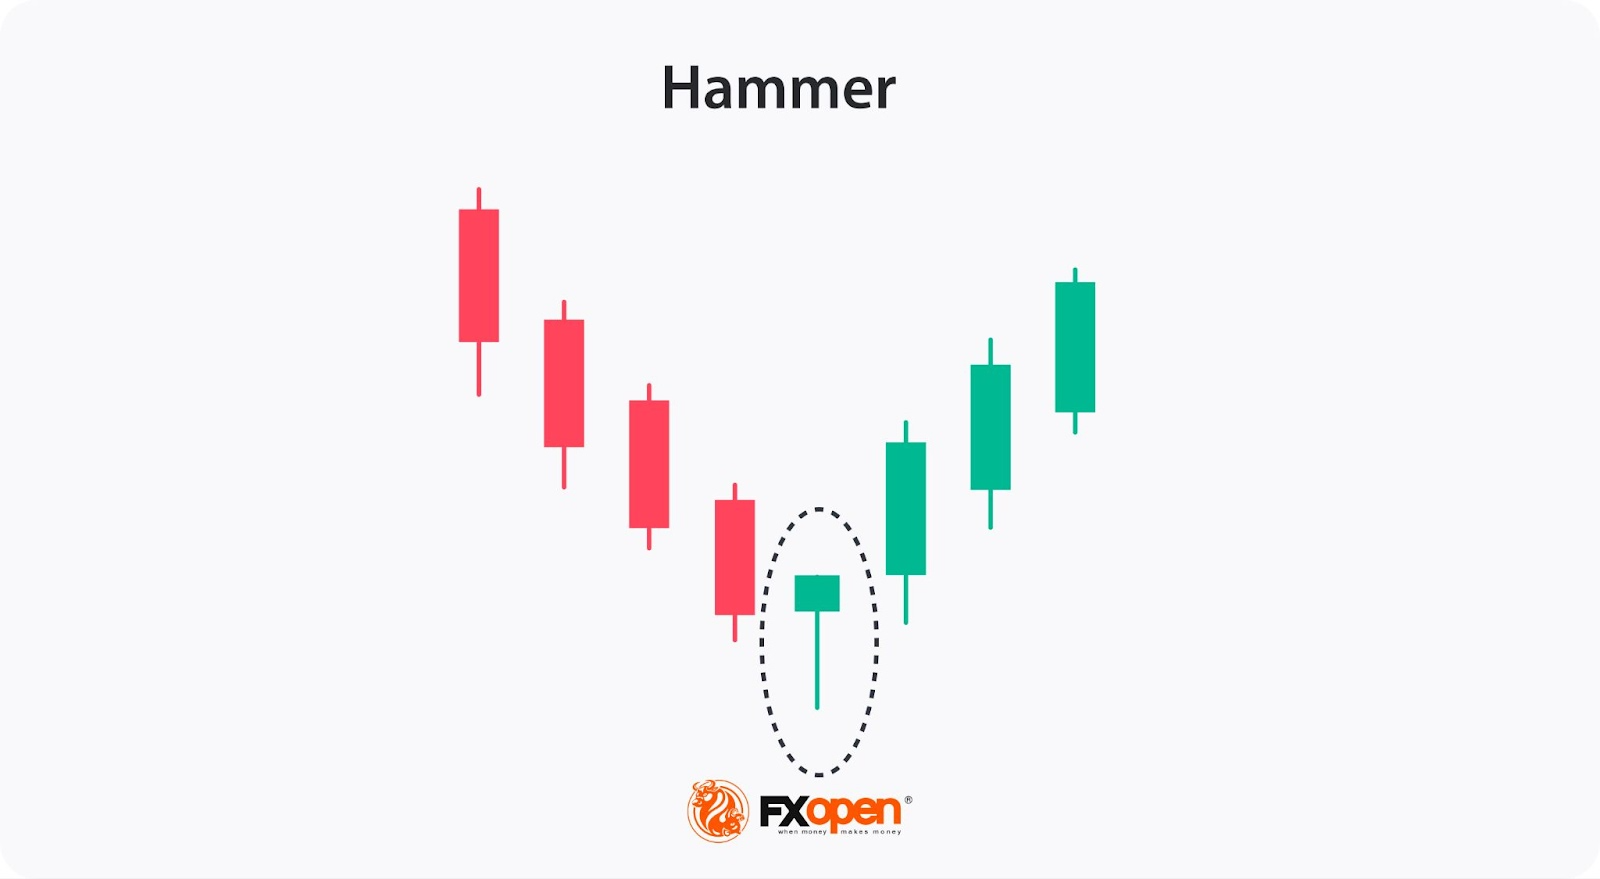
The hammer and hanging man are two single-candle patterns that indicate potential reversals, but they appear in opposite trend conditions. The hammer is one of many bullish reversal patterns that form at the end of a downtrend. It has a small body with a long lower wick at least twice the length of the body and little to no upper wick. This shape shows that sellers pushed the price down, but buyers regained control, pulling it back up near the opening price. Traders view this as a sign that downward momentum may be weakening.
The hanging man, on the other hand, is a bearish reversal candlestick that occurs at the end of an uptrend. It looks similar to the hammer, but it forms after a period of rising prices. The long lower wick reflects strong selling pressure during the session, though buyers managed to push the price back up, indicating potential weakness in the upward trend.
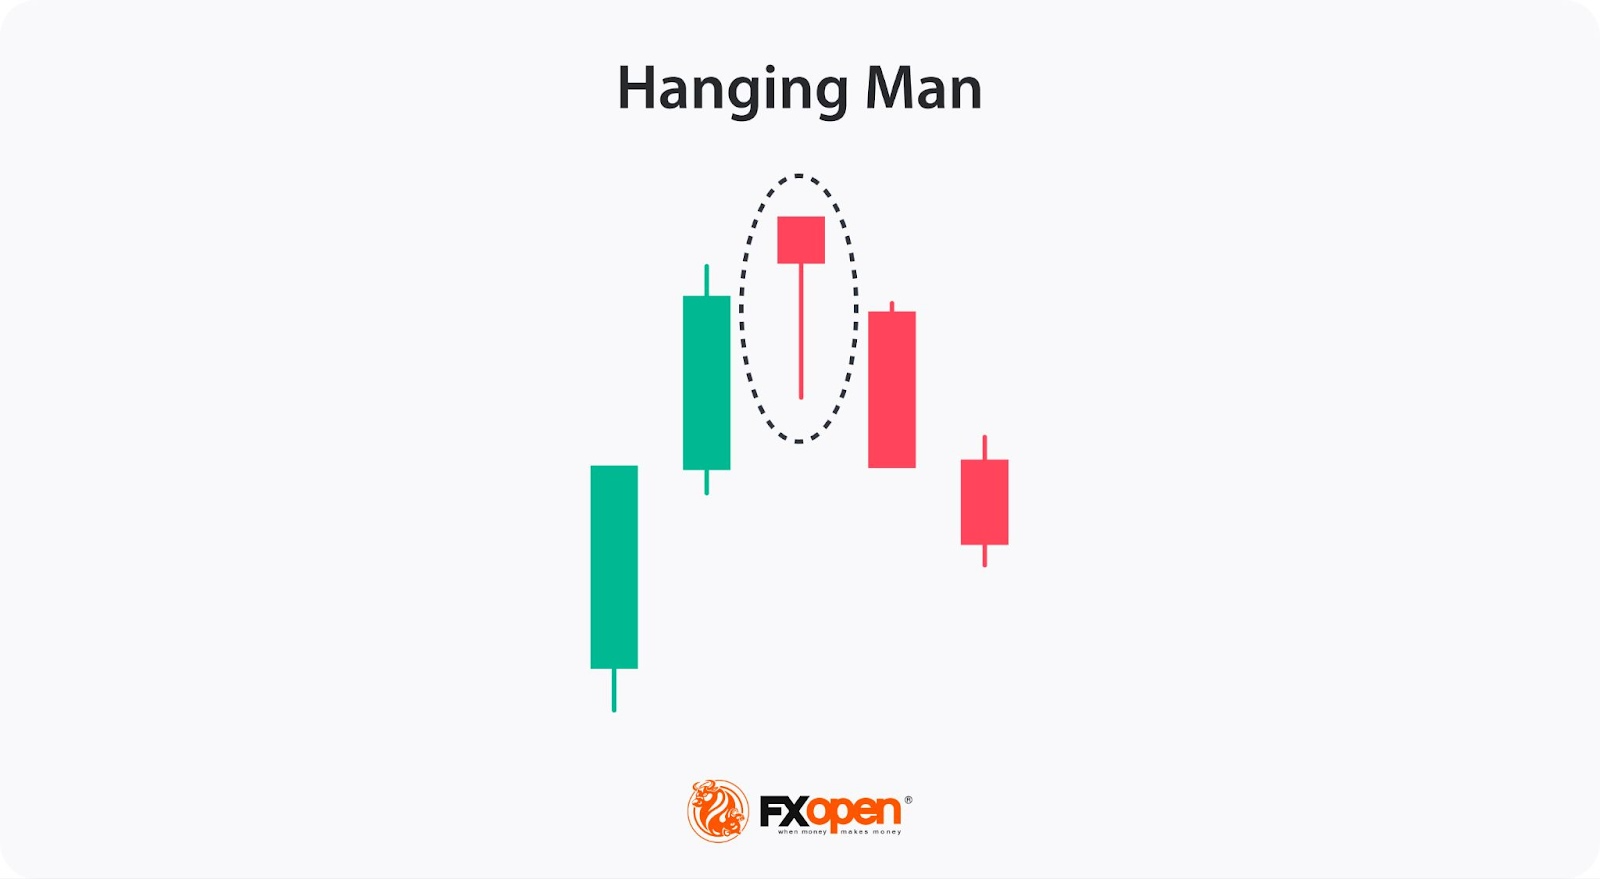
Traders often wait for confirmation from the following candle before acting, such as candles closing in the projected reversal direction, and usually place stop losses beyond the candlestick.
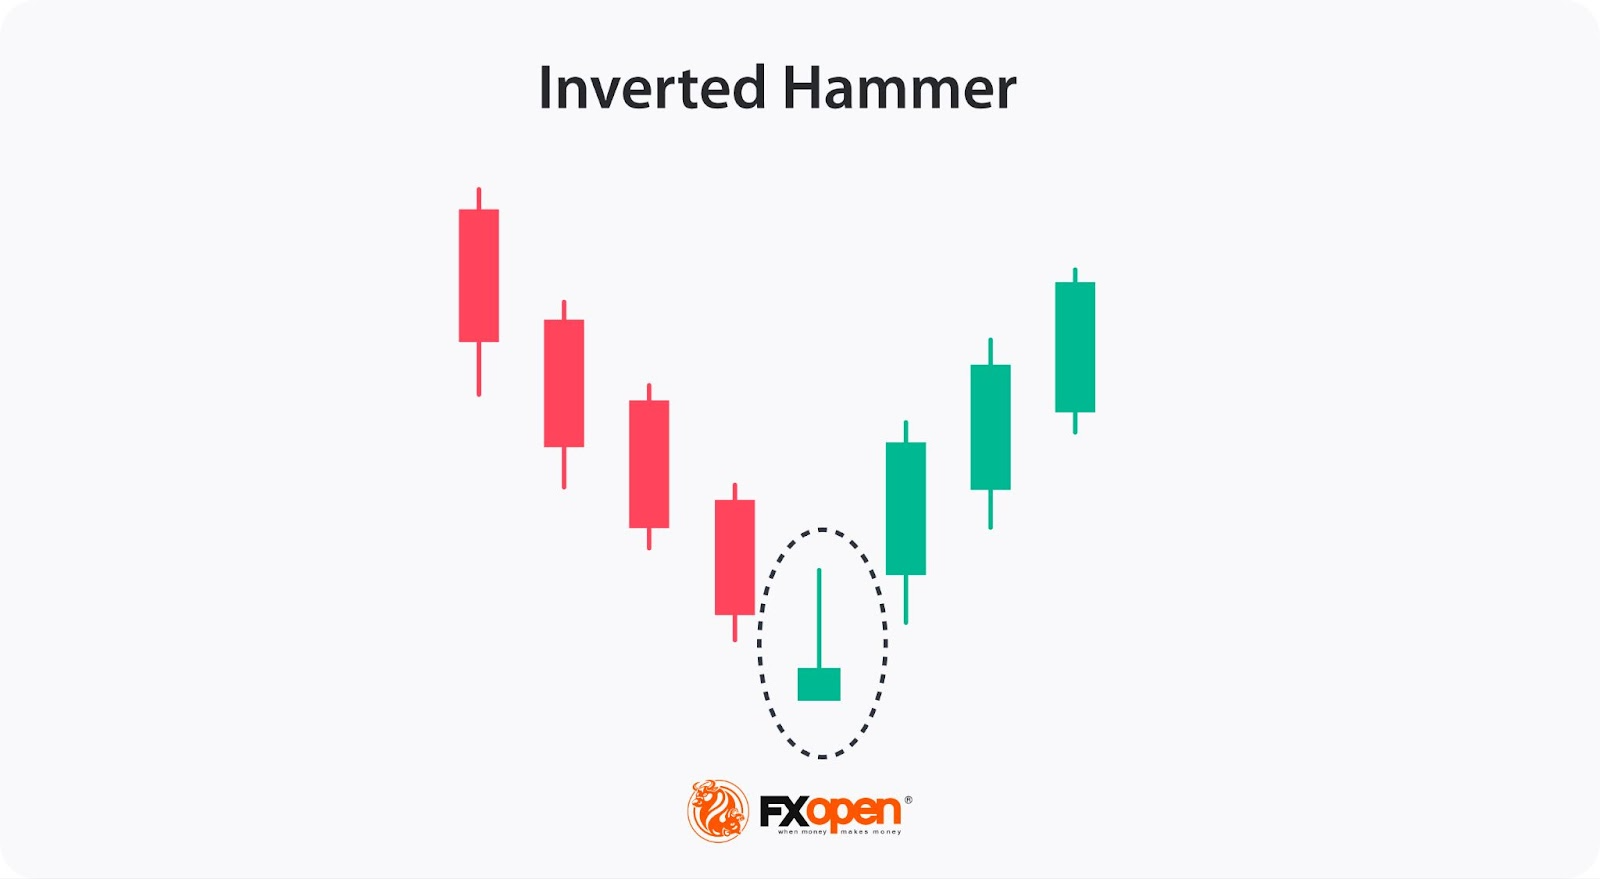
The inverted hammer and shooting star are both single-candle formations that suggest potential trend reversals. The inverted hammer appears at the end of a downward trend and belongs to the class of bullish reversal candlestick patterns. It has a small body, a long upper wick at least twice the length of the body, and little to no lower wick. This pattern forms when buyers push the price higher during the session, but selling pressure brings it back down. However, a strong upward movement indicates a shift in momentum.
On the other hand, the shooting star forms at the end of an upward trend and suggests a potential bearish reversal. Like the inverted hammer, it has a small body and a long upper wick, but it appears after a period of rising prices. The long wick reflects the market's initial attempt to move higher, only for sellers to take control and push the price back down.
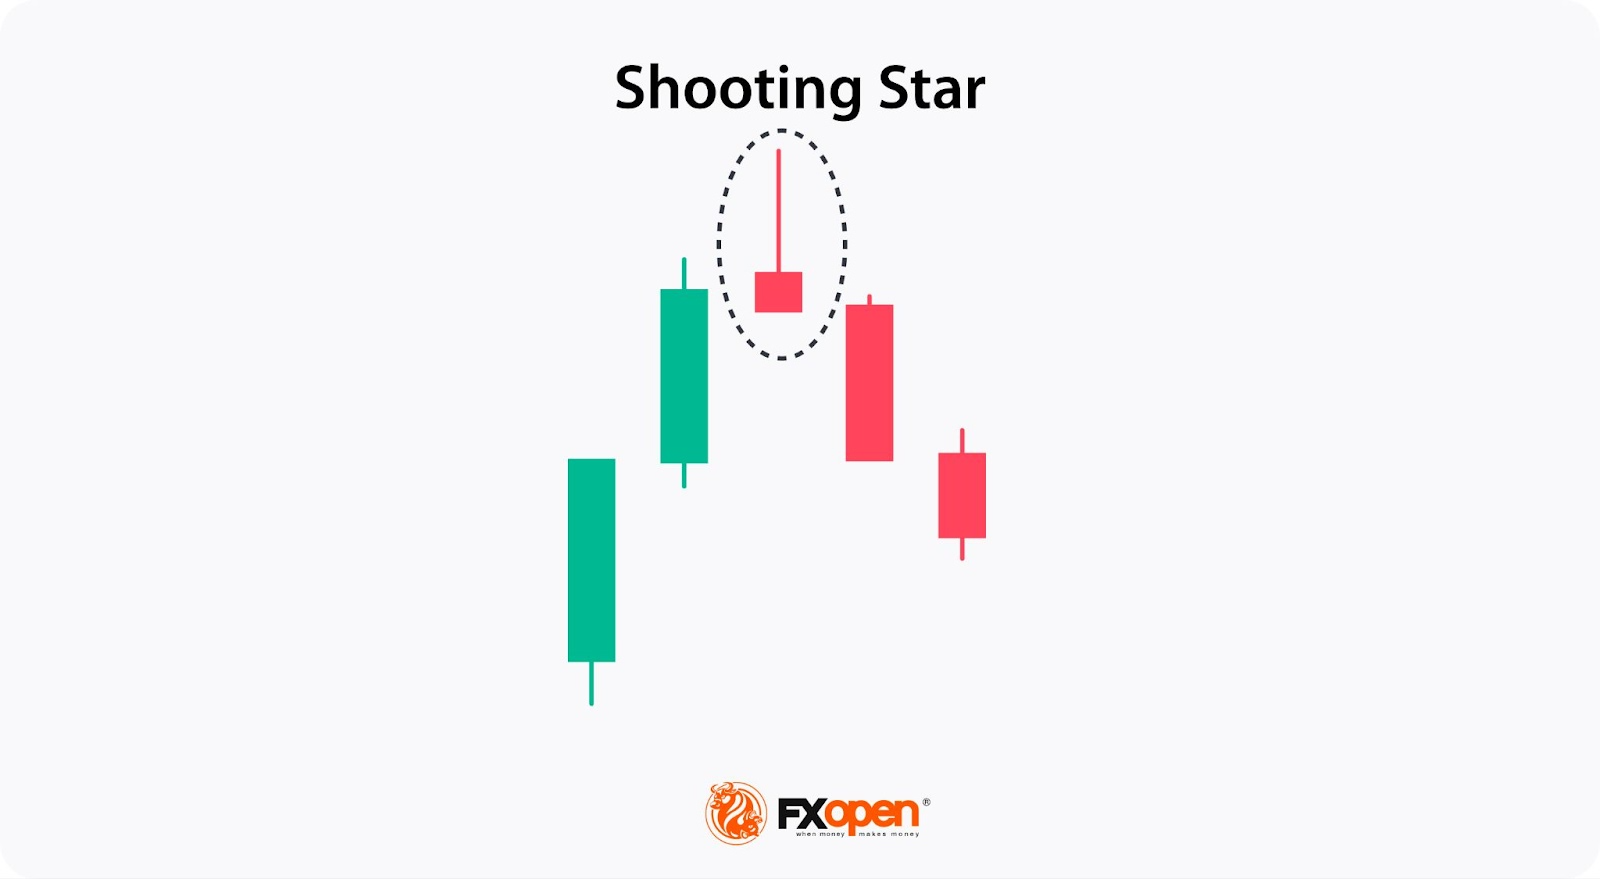
Traders typically wait for confirmation from the following candle before making a move, entering a trade if the reversal holds and often setting stop-loss orders beyond the candle.
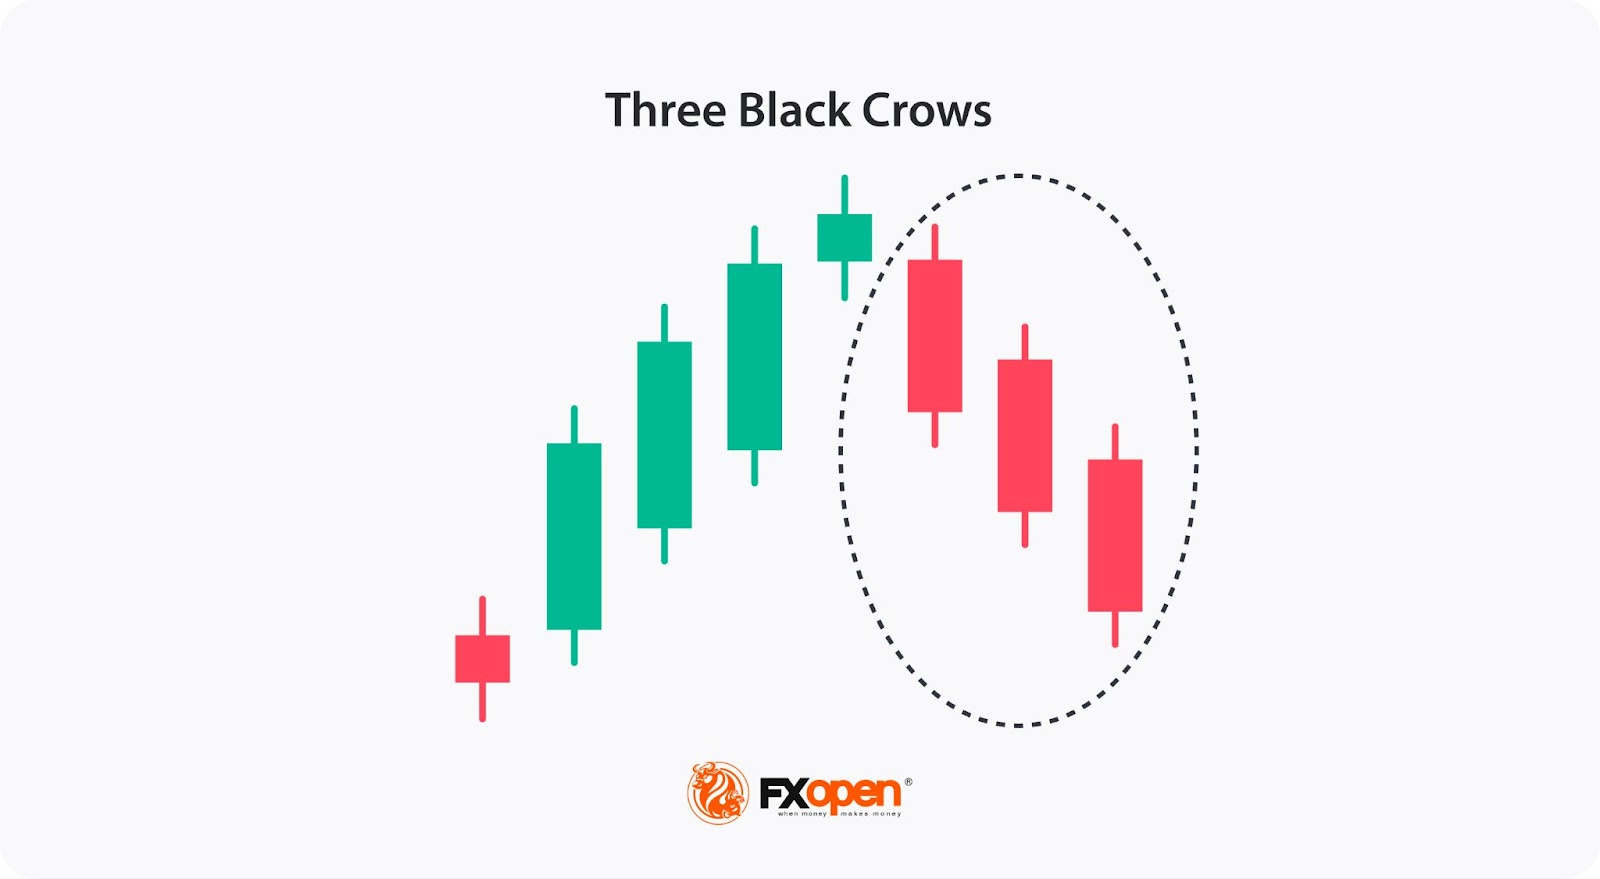
The three black crows formation consists of three consecutive bearish candles that appear at the end of an uptrend, signalling a potential reversal. Each candle opens within the body of the previous one and closes lower, with little to no lower wicks. This pattern suggests that selling pressure is increasing, and the upward momentum is losing strength, making a downward trend more likely.
In contrast, the three white soldiers formation consists of three consecutive bullish candles that form after a downtrend, indicating a shift in market sentiment toward buyers. Each candle opens within the body of the previous one and closes higher, showing strong buying momentum. The lack of long upper wicks suggests sustained bullish energy.
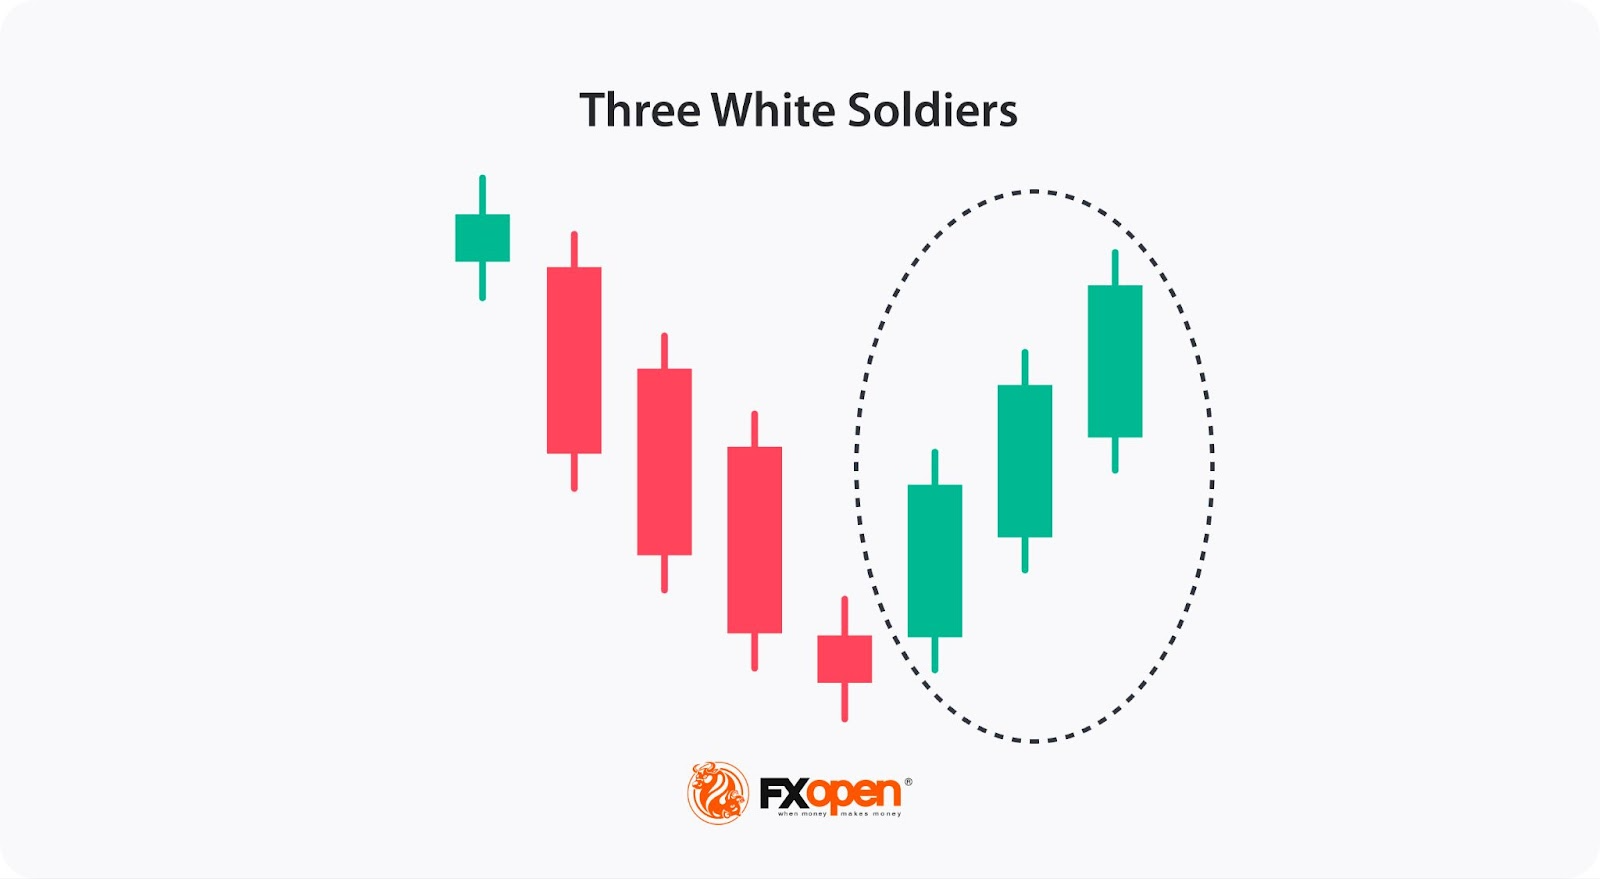
While the three black crows may provide an entry point for a sell trade, the three white soldiers reflect buying strength and potential bullish movement. As always, traders typically wait for further confirmation before acting, using other indicators or price action to validate these patterns. Stop losses are typically set beyond the high or low of the pattern.
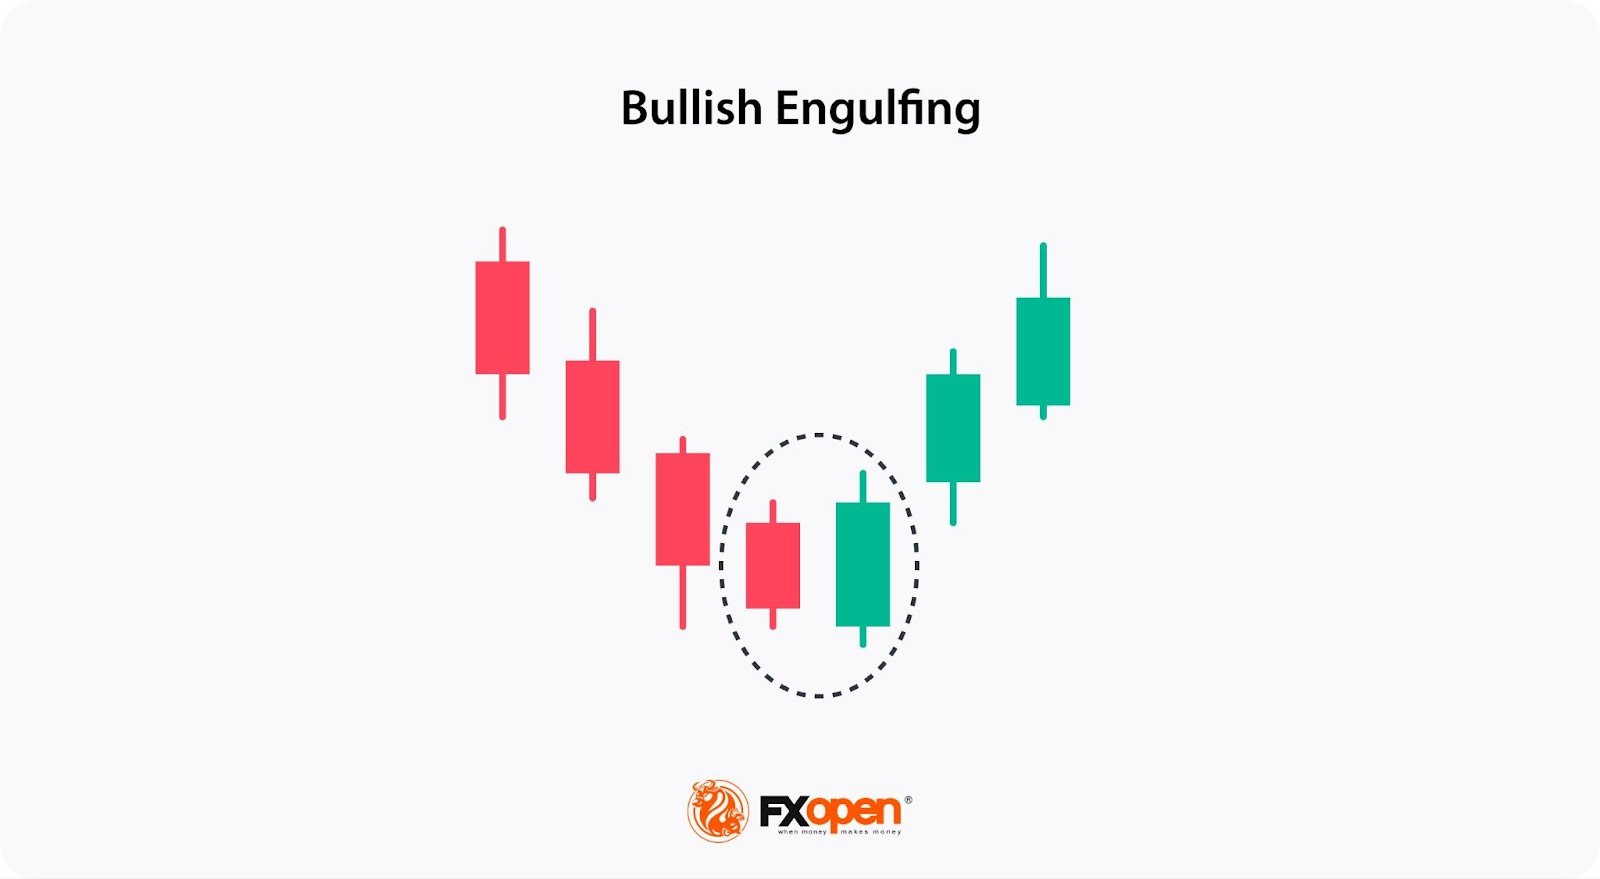
The engulfing candlestick pattern is a two-candle formation that can indicate either a bullish or bearish change in the market direction. A bullish pattern forms at the end of a downward movement when the body of a large bullish candle completely engulfs the body of the preceding bearish candle. The bullish candle opens lower than the previous one but closes higher, indicating a shift from selling to buying pressure.
When a bullish engulfing formation confirms a trend reversal, the price does not typically fall any further than the low of the second candlestick. Therefore, traders often use it to enter a trade at the market opening price after the second candle has closed and place a stop loss underneath the second candle’s low.
Conversely, a bearish pattern forms at the end of a bullish trend when a large bearish candlestick completely engulfs the previous small bullish candle. The bearish candle opens higher than the preceding candles but closes lower, suggesting the momentum could shift from buyers to sellers.
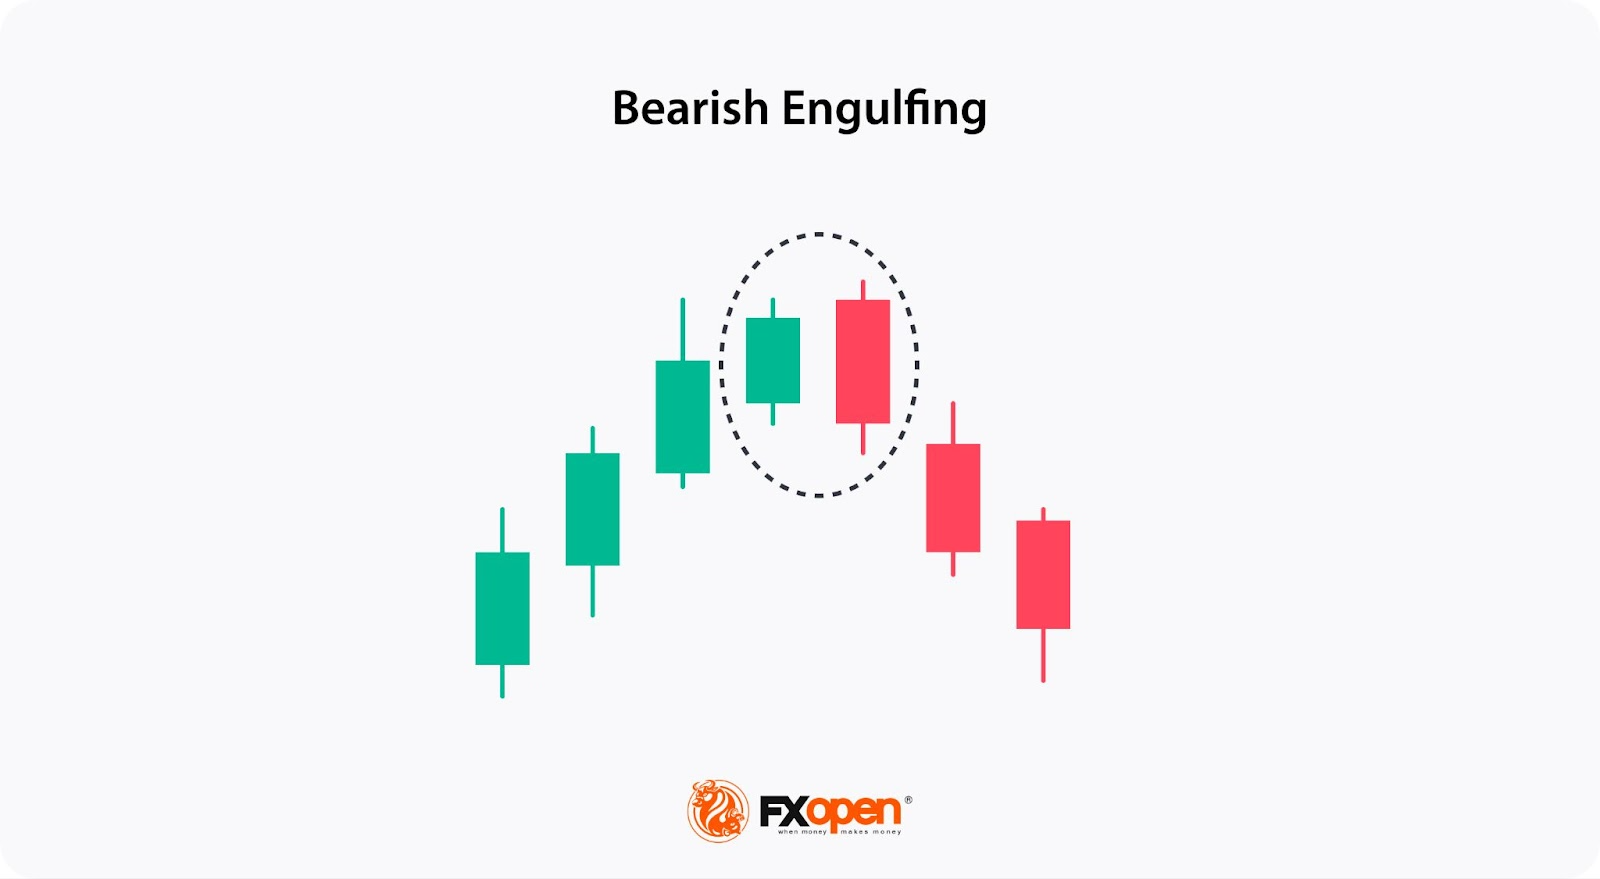
Traders often enter the market on the open price of the first candle after the engulfing and place a stop-loss order above the second candle’s high.
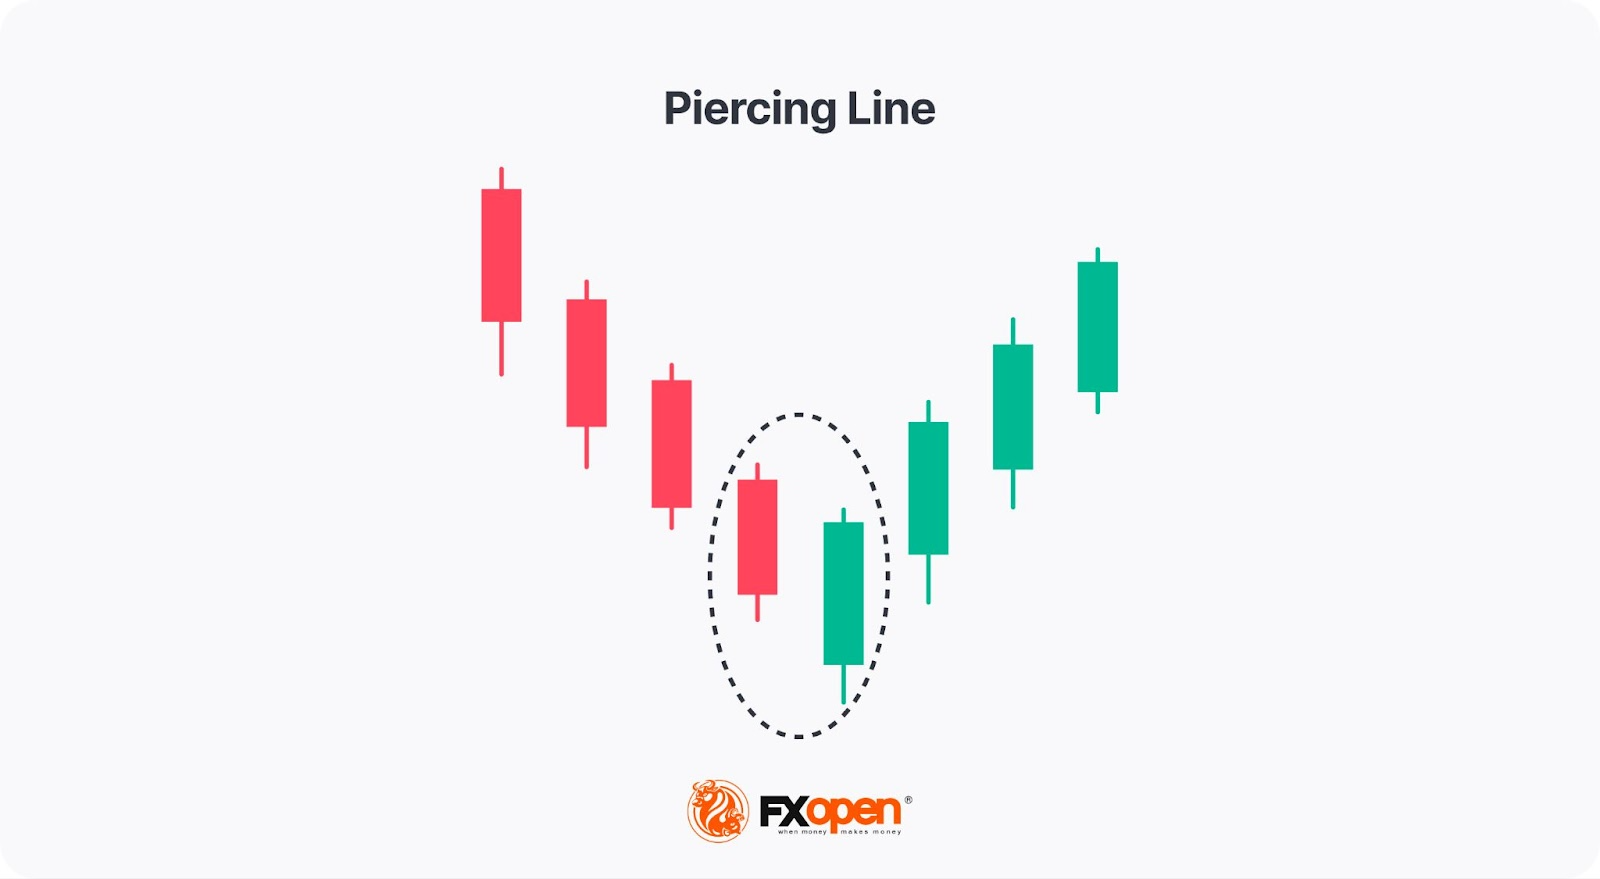
The piercing line and dark cloud cover are two-candle patterns. The piercing line is a bullish reversal formation at the end of a downtrend. It is formed when a long falling candlestick is followed by a long rising candle, which opens lower than the preceding candle but closes above its midpoint.
The length of the candles and the gap between them indicate how powerful the trend reversal will be: the longer the second candle, the stronger the signal; if there is a gap up after the second candle, the trend is stronger.
Traders usually wait for the price to form another candle after the piercing line formation. If it’s bullish, they go long. A stop-loss order is usually placed below the pattern’s second candle.
Conversely, the dark cloud cover is a bearish pattern formed by a long rising candle followed by a long falling candle that opens higher than the prior one but closes below its midpoint. By opening higher, the second candle provides an optimistic view of the future price rise; however, it reverses more than half of the previous gain. This explains the formation's name, as it starts "sunny," but the "dark cloud cover" moves in. The bearish signal is stronger if the next candlestick closes below the bottom of the first, as the price could then fall steadily for some time without a higher retracement.
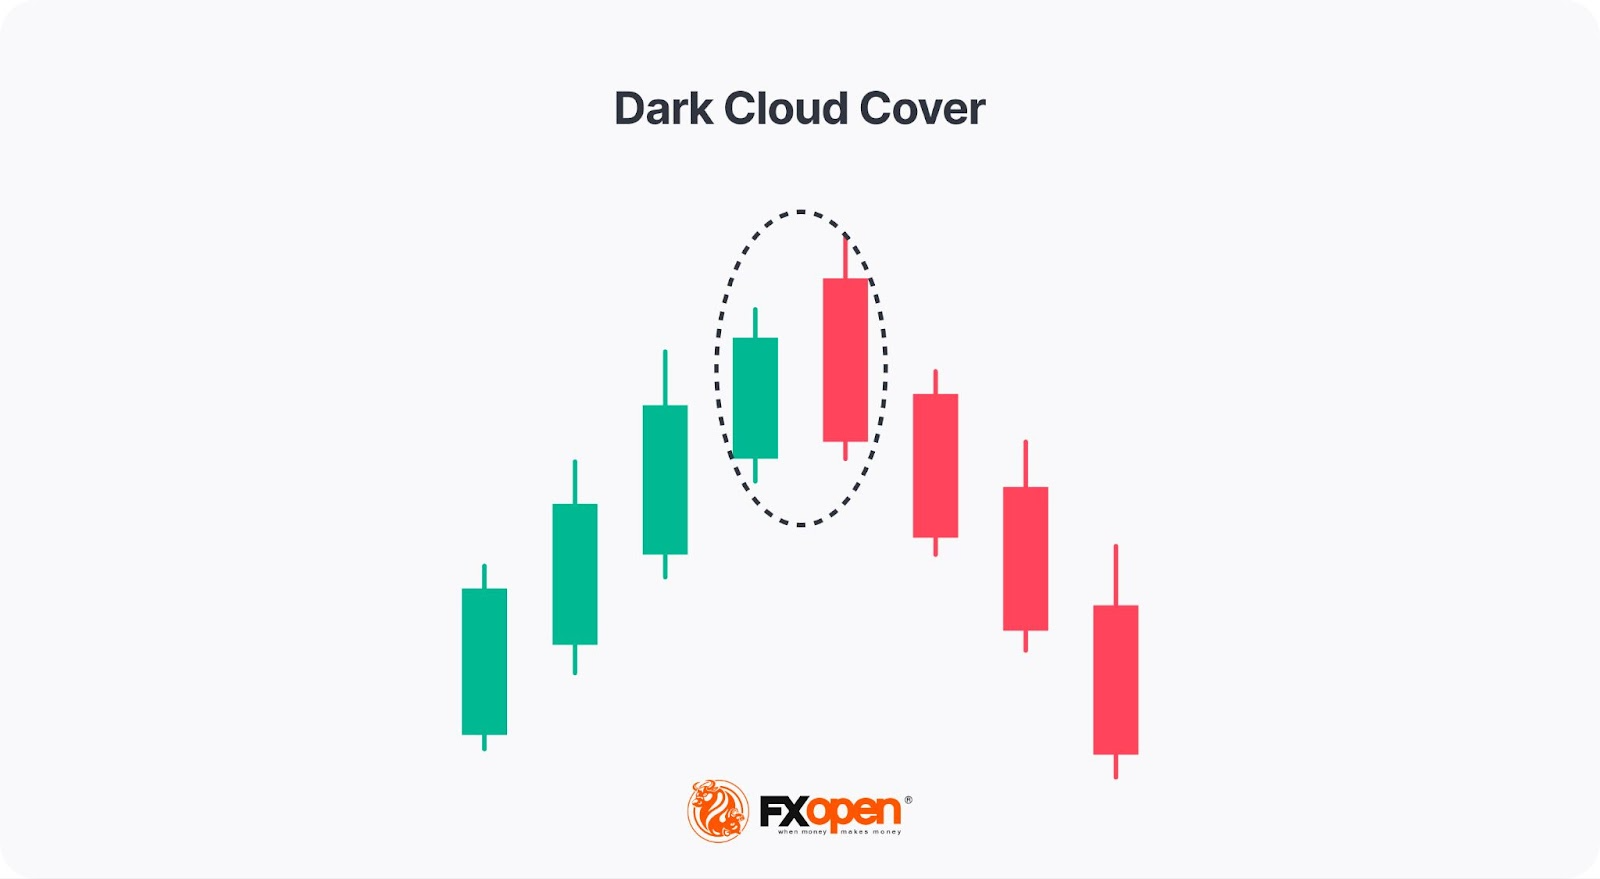
As with the piercing line structure, the length of the candles and the gap between them signals the strength of the trend reversal. Traders wait for another bearish candle to be formed after the pattern. If there is one, they go short and place a stop-loss order above the pattern’s second candlestick.
If you want to test trading strategies with the above-mentioned trading patterns, you can use the TickTrader platform by FXOpen, which offers over 1,200 tools for market analysis.
Candlestick reversal patterns are practical and time-tested tools for identifying shifts in market direction. Whether applied in forex, stocks, indices, or commodities, these reversal setups provide valuable insights into market psychology and trader behaviour. Mastering candlestick reversals is not about memorising shapes—it’s about interpreting sentiment and momentum shifts to gain trading insights.
Traders who want to test candlestick patterns and develop their own strategies, can consider opening an FXOpen account today and access over 700 markets with tight spreads and low commissions. Good luck!
A reversal candle typically has a distinct shape, signalling a potential change in trend. Traders look for patterns like hammers, inverted hammers, or engulfing candles, which often appear at the end of a trend. The reversal candle pattern is generally confirmed when the next candle moves in the opposite direction of the preceding trend.
There is no strongest pattern as all market analysis tools have their limitations. However, the engulfing pattern is considered one of the popular reversal signals. A bullish engulfing reflects a potential reversal from a downtrend, while a bearish engulfing suggests a reversal from an uptrend.
A three-candle reversal is a pattern consisting of three consecutive candles that indicate a potential trend shift. Examples include the three black crows for bearish reversals and three white soldiers for bullish reversals.
Traders use reversal patterns to identify potential trend changes. The strategy typically involves waiting for confirmation from the next candle or additional technical indicators before entering a trade.
There is no single most popular indicator. However, moving averages and the Relative Strength Index (RSI) are popular indicators to confirm trend reversals. They may help identify the change in the market momentum, supporting the signals given by reversal candle patterns.


