
Candlestick wicks often contain critical information about buying and selling pressure that body patterns alone may not reveal. By analysing wick length and position, traders can understand price rejection, momentum shifts, and liquidity zones.
In forex and CFD markets, sessions run long and liquidity shifts across the day. That setup often produces rejections at session boundaries, round numbers, and structural levels. Wick analysis trading may offer a quick read on sentiment that body-only views can miss. This article explains the candle wick meaning and outlines several strategies traders may use.
Candle wicks, or shadows, are the thin lines above and below a candlestick’s body that indicate how far the price moved during a specific period. The upper wick marks the highest price reached during the candle's period, and the lower wick marks the lowest.
Candle wicks, extending beyond the body of the candlestick, offer a deeper insight into market dynamics than open and close price levels. Their lengths and positions relative to the candle body unveil the tug-of-war between buyers and sellers within a given timeframe.
Wicks reflect rejection and volatility in a single visual. Each wick records a price the market reached but failed to hold. Longer wicks point to wider intraperiod ranges and more aggressive two-way action. Short wicks suggest price stayed close to its open and close throughout the period.
A long wick candle to the upside suggests that buyers pushed the price higher, but sellers eventually overcame, driving the price down from its peak. Conversely, a lengthy lower wick indicates sellers initially dominated, with buyers making a strong comeback.
Such patterns are not merely reflections of high volatility; they signal potential market reversals or continuations, depending on their context and the prevailing trend. For instance, a series of increasing lower wicks in a downtrend could hint at a building bullish pressure. Traders often scrutinise these subtle cues, aligning them with other technical indicators to refine entry and exit points.
The table below summarises how the three main wick patterns are commonly read:
Wick type | What it shows | Common reading |
Long upper wick | Buyers pushed price up, sellers reclaimed control before close | Rejection of higher prices |
Long lower wick | Sellers pushed price down, buyers reclaimed control before close | Rejection of lower prices |
Short wick | Price stayed close to open and close throughout the period | Limited rejection, often reflects trend conviction or low volatility |
The wick-to-body ratio sorts candles into four rough categories of candlestick patterns.
Indecision candles have a small body between two long wicks. Both sides pushed price away from the middle and neither held ground. Doji and spinning tops fall into this group.
Rejection candles have a small body at one end of the range and a single long wick at the other. One side pushed hard before the other overwhelmed them, producing a rejection candle pattern often seen at key levels.
Momentum exhaustion shows up after a strong directional run. A large body with disproportionately long wicks suggests the move stretched far enough that opposing pressure started pushing back, hinting momentum rejection is building.
Strong momentum candles usually have a large body with small or no wicks. This reflects sustained directional pressure where price closed near the session high or low with limited rejection. Marubozu candles are a common example and are often associated with strong breakout or trend continuation moves.
Wicks serve as a lens to view underlying market conditions, offering insights into trader sentiment, potential reversals, and the strength of current trends. This analysis predominantly focuses on the length and frequency of long wicks, as they often carry more significant information than their shorter counterparts.
Context shapes what a wick is telling traders. A long wick on a 5-minute chart in a quiet session reads differently to the same wick on the daily at a multi-month high. Traders typically check the prevailing trend, the timeframe, and nearby structural levels before drawing conclusions from any single candle.
Long lower wicks during pullbacks in an uptrend, or long upper wicks during bounces inside a downtrend, often indicate the dominant side stepped back in to defend the trend. A cluster of these wicks across consecutive candles tends to reinforce the read. Traders sometimes treat them as a trend continuation signal aligned with the existing direction.
A wick that pierces a level and closes back inside the prior range is the textbook failed breakout candle signature. One side attempted to extend the move, found no follow-through, and price snapped back. These wicks are common after consolidation breaks that lack volume or wider confluence.
A long wick spiking through an obvious swing high or low before reversing may indicate a liquidity sweep, where price extended just far enough to trigger clustered stop orders before reversing. Wicks of this type often appear at session highs and lows, where stops tend to accumulate.
Forex wick trading and CFD wick analysis tend to focus on a handful of repeatable settings where wicks carry more weight than usual.
The wick analysis trading strategies below share a common foundation. Each one treats a long wick as evidence of price rejection candle behaviour at a level that already carries technical weight. Wick candle trading is usually based on the conditions when the wick lines up with prior structure, a Fibonacci level, a moving average, or another reference point that other traders are also watching.
A single candle in isolation is rarely enough for candlestick wick analysis. Traders typically wait for the candle to close, look for confirmation from surrounding price action, and check the broader trend before treating any wick as a setup.
Now, let’s explore three long-wick trading strategies. If you’d like to see how they work in practice, consider following along in FXOpen’s TickTrader platform.
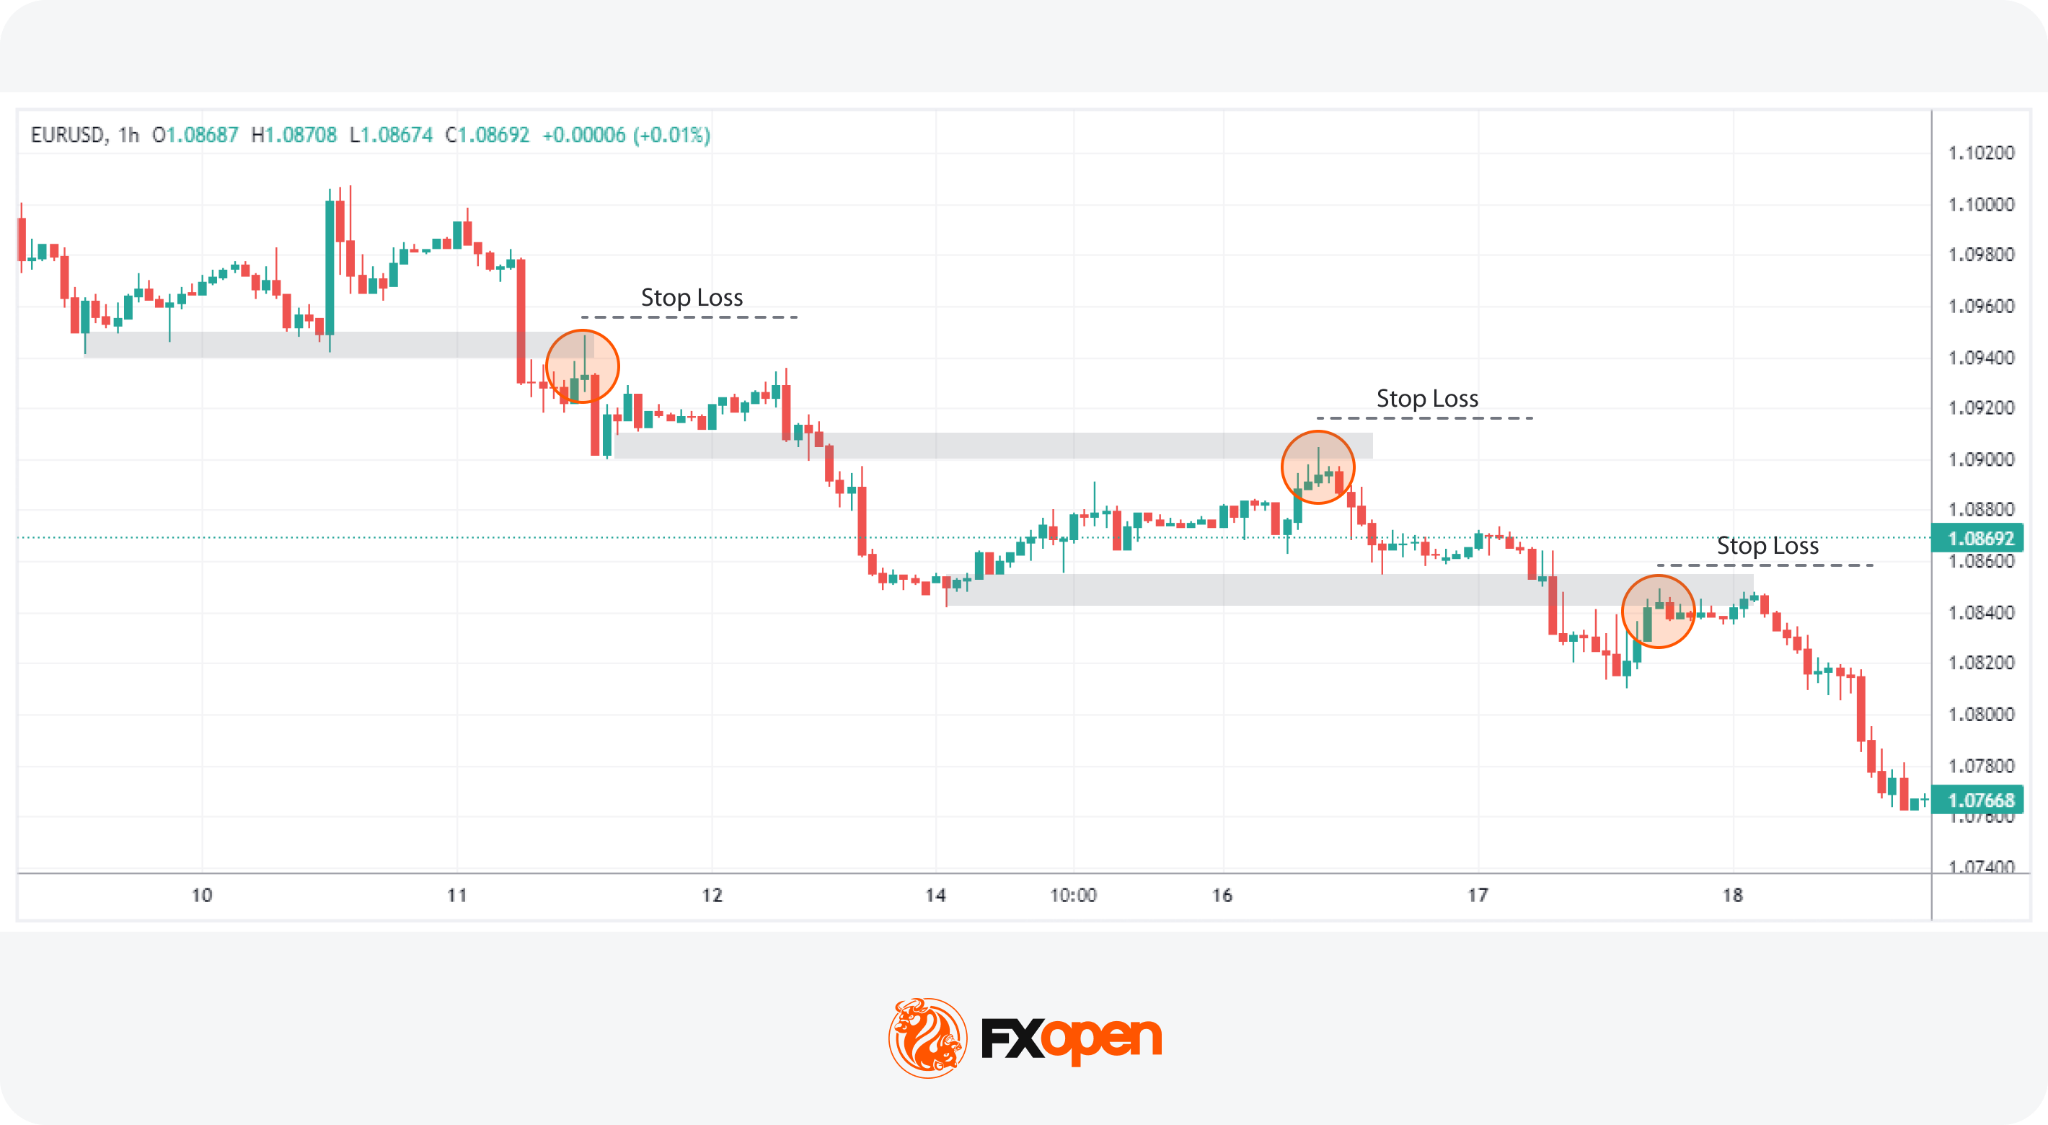
In the realm of long-wick candle trading, the strategy focusing on extended wicks during trend pullbacks may be insightful. The strategy focuses on temporary pullbacks within an established trend, using long wicks as signs of rejection and potential trend continuation.
Identifying the trend first is what separates wick candle trading from random wick-chasing. Traders typically look for a sequence of higher highs and higher lows in a bullish trend, or lower highs and lower lows in a bearish one. A 50- or 200-period moving average may also support the read on direction. On 15-minute and 1-hour charts, the trend is judged against intraday structure. On the 4-hour, traders typically take a broader swing view spanning several days.
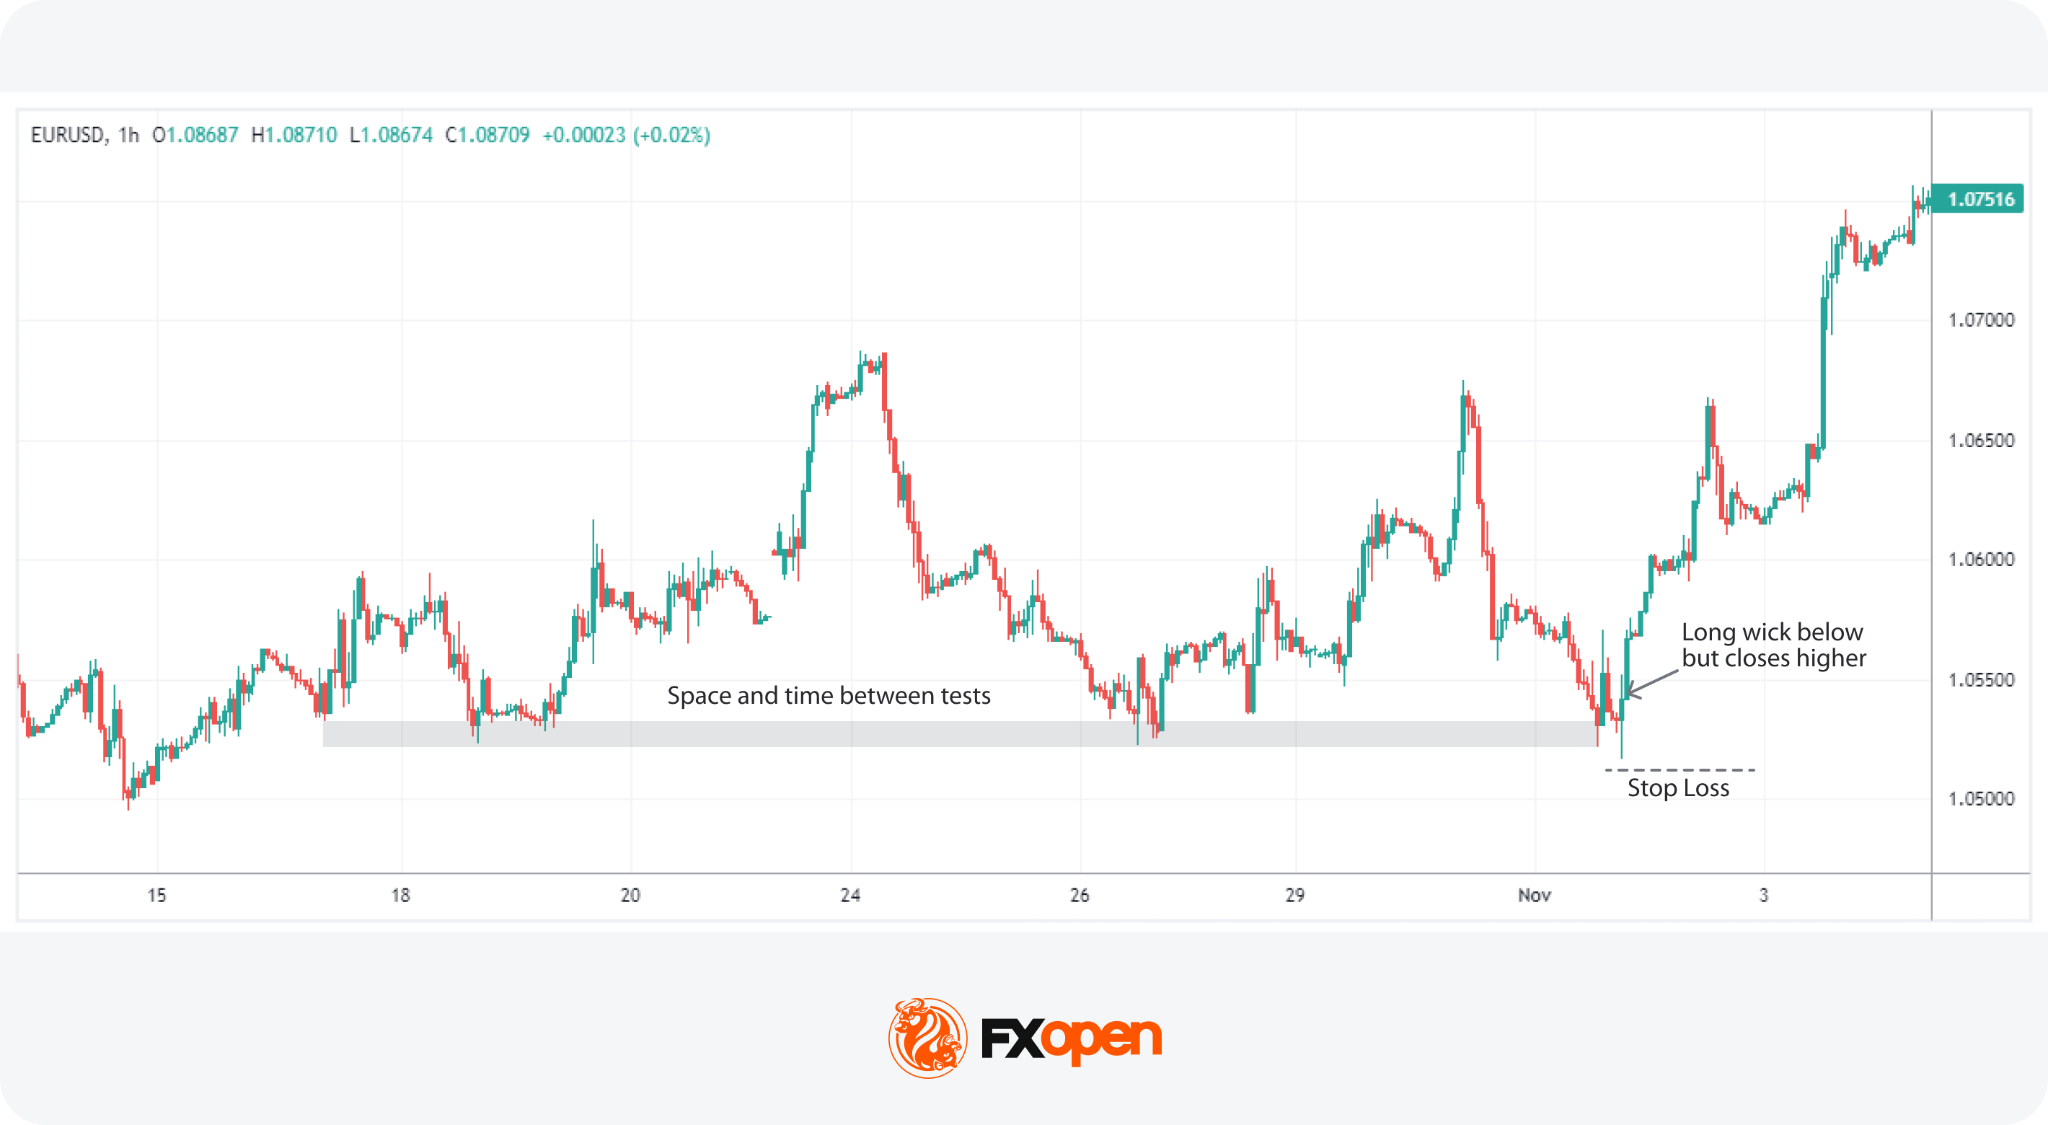
The strategy of focusing on long wicks on candlesticks at significant support or resistance levels leverages the market's reaction to these critical areas. It's a technique that thrives on the premise that major horizontal support or resistance, which have been tested multiple times with significant highs or lows, act as strong psychological barriers for price movements.
This method is more popular when there is clear visual space on the chart and considerable time between the tests of these areas, emphasising the significance of these levels.
When price briefly moves beyond support or resistance before quickly reversing, the resulting long wick may indicate rejection of higher or lower prices. Some traders interpret this type of move as a failed breakout, especially when the candle closes back inside the prior range.
On the risk-management side, traders often place stop losses beyond the wick high or low while keeping position size aligned with their overall risk limits.
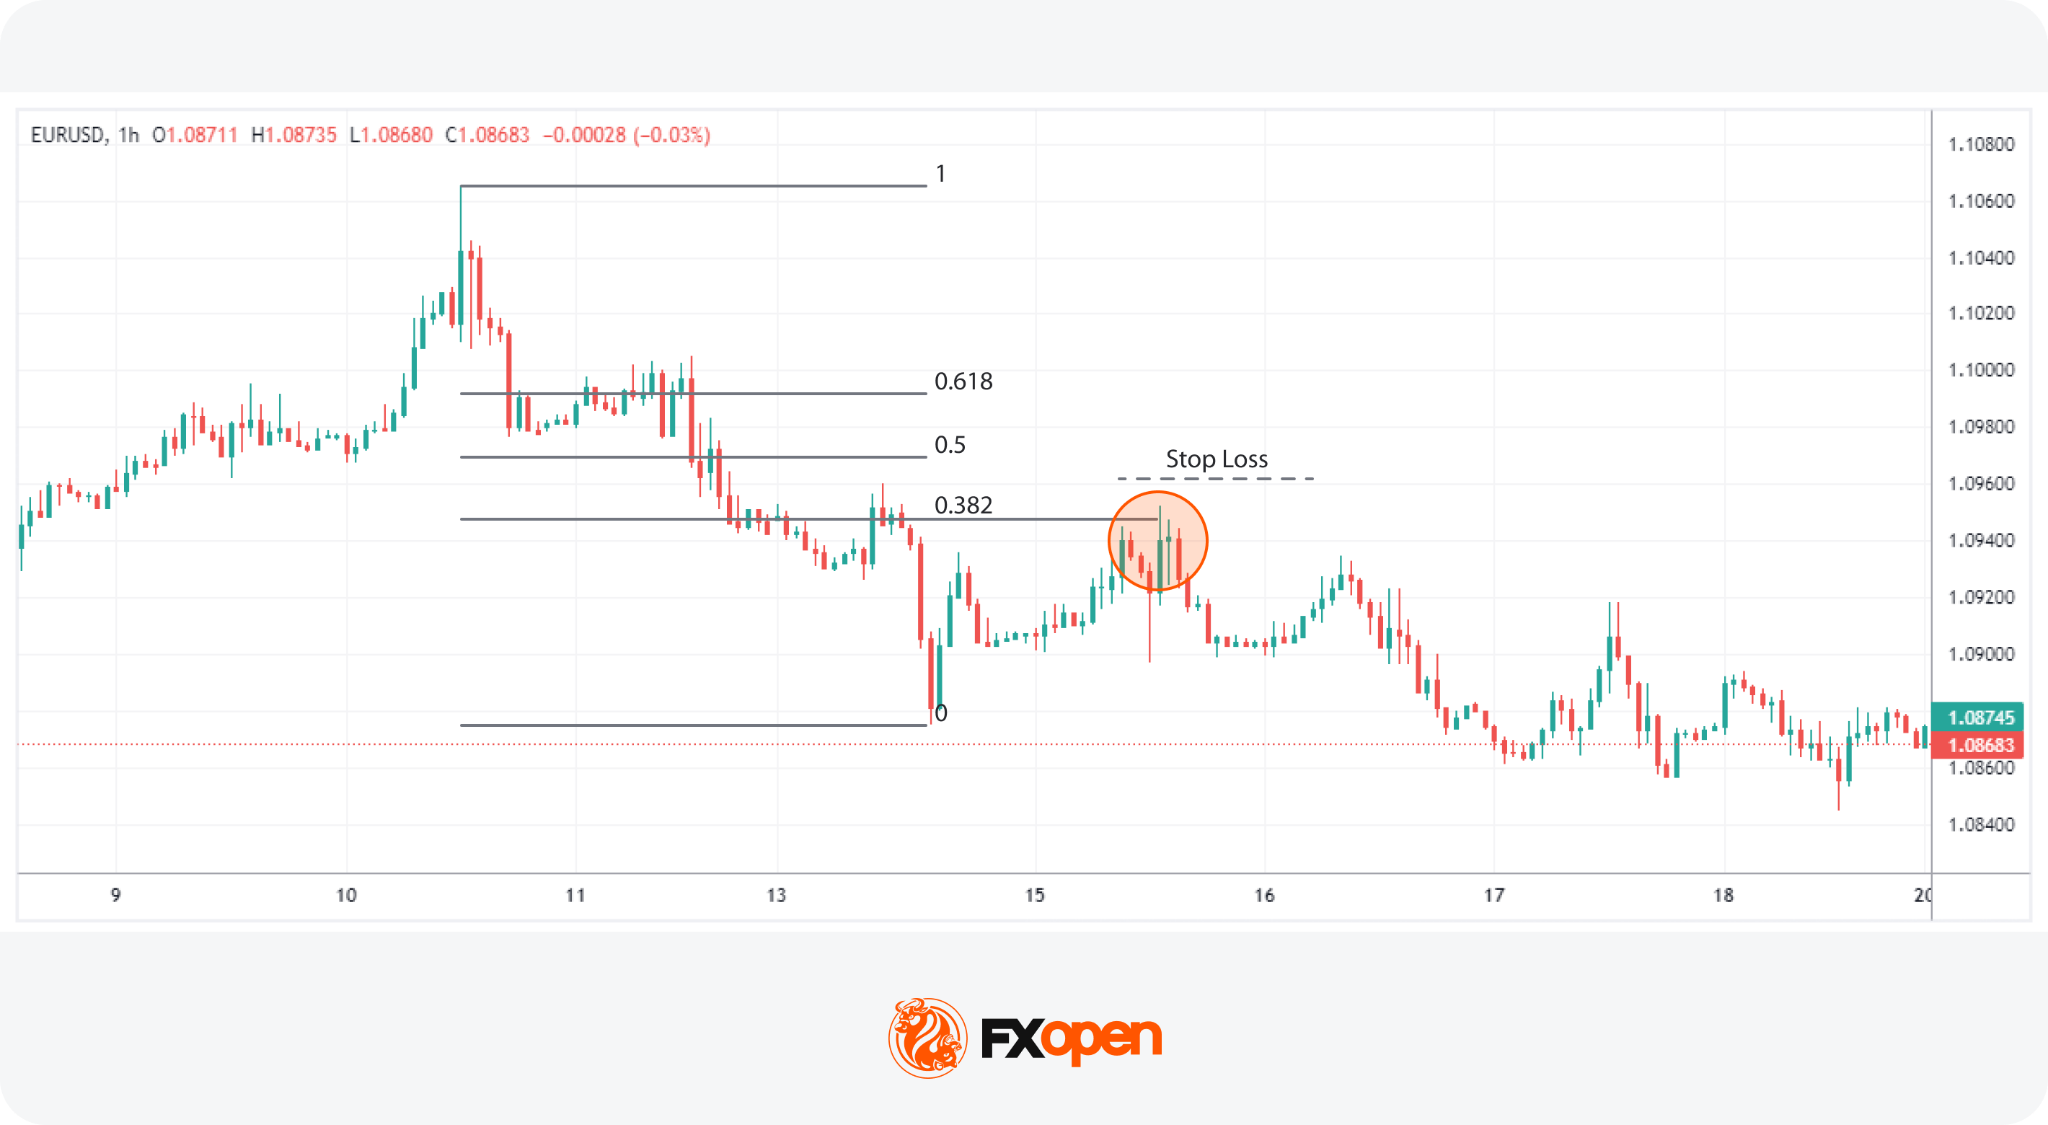
In this strategy, traders use Fibonacci retracements in tandem with candlestick analysis to anticipate trend continuations. The approach starts from a clear trend, with the retracement drawn across the most recent swing.
Fibonacci levels carry more weight when they line up with other technical reference points. Key levels of interest are the 0.382, 0.5, and 0.618 retracement levels, which act as zones of interest rather than precise lines. Traders look for them to overlap with horizontal support or resistance, a prior swing point, or a moving average. A long wick rejecting a Fibonacci level in isolation is generally read with more caution than the same wick at a Fibonacci-plus-structure confluence.
Candlestick wick analysis often works alongside volume. A wick that prints on noticeably higher volume than the surrounding candles tends to carry more weight than the same wick on thin participation. Relative volume, judged against an average of the prior 20 or 50 periods, is the common way traders frame this read.
Absorption is one behaviour worth watching. When price pushes into a level and the candle prints a long wick on elevated volume, it may suggest that resting orders on the defending side absorbed the move without giving ground. The wick records where buyers or sellers tried to extend the move, and the volume records how much pressure it took to push them back.
Rejection behaviour reads similarly. A long upper wick on heavy volume at resistance may indicate selling interest was meaningful rather than incidental. The same wick on light volume offers less confirmation, and traders typically treat it with more caution.
Traders using volume indicators in forex often supplement them with tools such as Volume Profile or session-based reads.
In the world of big wick candle trading, there are some common practices that traders may consider:
A single wick says far less than the sequence around it. Traders typically zoom out before acting on any wick, checking the prior two or three candles for confirmation that rejection was sustained rather than fleeting.
A long lower wick that prints below support is one signal. The next candle closing back inside the range with a strong body is a second. Without that follow-through, the original wick can be a false alarm, especially during low-volume periods or news-driven spikes. Reading wicks alongside trend, structure, and at least one secondary signal tends to filter out the noise that catches traders acting on a single bar in isolation.
Wick trading strategy approaches have real limits and traders typically build that into how they use them:
Wick analysis is usually used as one input in a broader technical framework that also draws on trend identification, structural levels, volume, and risk management. Treating it as a standalone system invites the limitations above to dominate the results.
While candle wicks may seem like minor visual elements, they often reveal some of the market’s most telling signals. From highlighting rejection zones to exposing failed breakouts, wicks can support traders when building a trading strategy. Many traders use wick analysis inside a broader price action trading framework, alongside trend identification, structural levels, volume, and risk management rather than in isolation.
If you would like to trade with over 1,200 tools and indicators, you can consider opening a forex trading account with FXOpen and gain access to trading in over 700 markets.
Long wicks indicate a potential rejection of a given price level. A long upper wick suggests selling pressure after a price hike, while a long lower wick indicates buying support following a drop.
To read candle wicks, traders examine their length and direction. A long wick signals rejection of prices, especially if it occurs at a support or resistance area. Upper wicks denote selling pressure; lower wicks point to buying interest.
Trading candle wicks involves analysing long wicks for potential market reversals. Traders often look for wicks at support or resistance levels as signals to enter or exit trades, using them alongside other indicators for confirmation.
The candle wick trading strategy utilises the presence of long wicks as indicators for making trading decisions. This approach relies on the idea that wicks signify price rejections and potential shifts in market direction, aiding in identifying entry and exit points.
A long upper wick indicates that buyers pushed price higher during the period but sellers reclaimed control before the close. It typically reflects rejection of higher prices. Near resistance or after an extended rally, it may suggest weakening demand and the potential for a reversal or pause in the trend.
Yes. Wick analysis is widely applied across forex pairs, particularly at session highs and lows, round-number levels, and major support and resistance zones. Forex traders often combine wick reads with broader price action and risk management rather than treating any single candle as a standalone signal.
Wick analysis works across timeframes, though the read changes with each one. Day traders often watch 5-minute and 15-minute charts, swing traders favour the 1-hour and 4-hour timeframes, and position traders typically focus on daily and weekly candles. Higher timeframes generally produce wicks that carry more weight.
Wick signals during major news events may be weak. Sharp volatility, widened spreads, and algorithmic reactions can produce dramatic wicks that revert quickly. Many traders avoid acting on wicks formed inside news windows and wait for the market to settle before reassessing the technical picture.





