
Scalping in the crypto market is a complex approach that requires traders to cope with high volatility and constant price fluctuations. It is based on rapid decision-making and entry/exit precision. In this article, we explore five scalping techniques, outlining their main features and role in navigating the fast-moving cryptocurrency market.
As in any other financial market, in cryptocurrency trading, scalping refers to a type of trading where traders aim to take advantage of short-term market movements. This approach involves entering and exiting trades within minutes, or even seconds, aiming to capitalise on small fluctuations in price.
According to theory, scalpers typically use high leverage and execute many trades to make seemingly insignificant potential gains that add up rather than seeking larger, less frequent potential returns. Scalping is particularly popular in crypto trading, as digital assets are inherently volatile and experience extreme daily price changes.
Scalp trading in the cryptocurrency market has its advantages and disadvantages. Let’s examine some of the most notable pros and cons.
Let’s dive into particular strategies.
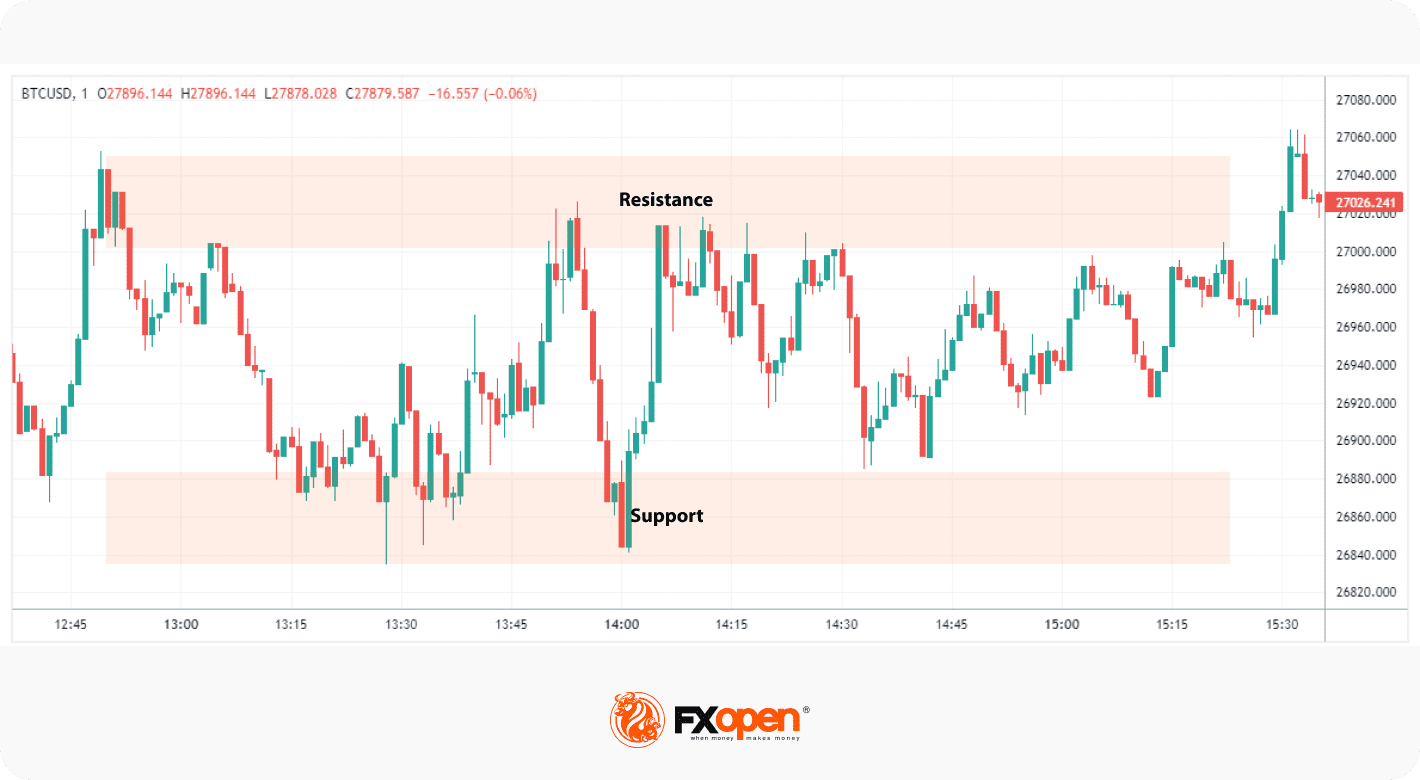
Range trading is a popular strategy among crypto scalers. It involves identifying a specific consolidation range that an asset is likely to fluctuate within. Scalpers aim to buy at the lower end of the range (support) and sell at the upper bound (resistance).
To get started with range trading, traders first need to identify a ranging market on a low timeframe, like the 1 or 5-minute charts. Then, support and resistance levels near the highs and lows of the range are identified. These levels then serve as entry and exit points, with a trader entering at support looking to exit at resistance and vice versa.
Some will look for reversal candlestick patterns, like hammers or shooting stars, at support or resistance, respectively, before entering with a market order. Others will simply set limit orders at their chosen entry point.
Stop losses are typically placed beyond the range’s high or low, depending on the direction of trade. Scalpers usually use a 1:1 risk/reward ratio or don’t place stop-loss orders, but the latter is a highly risky approach.
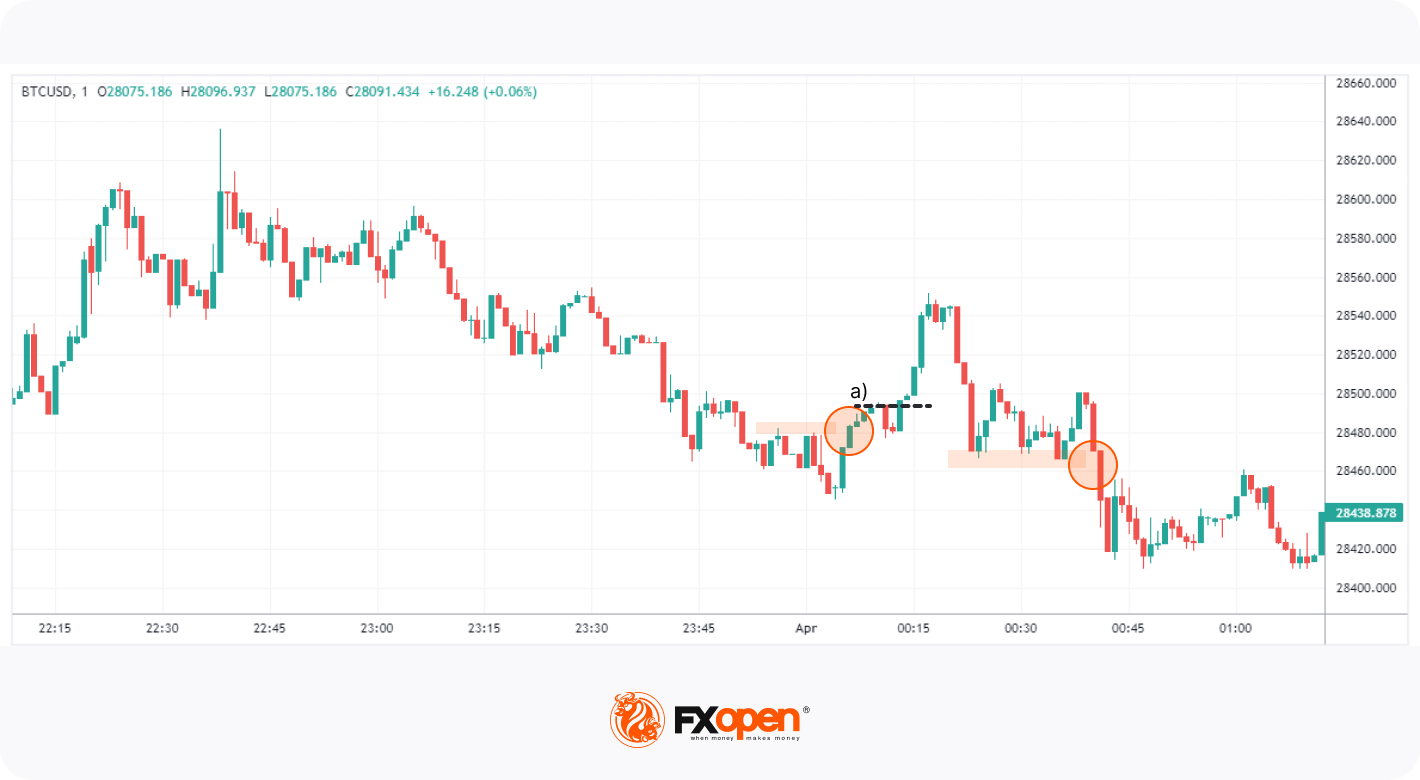
Breakouts occur when a level of support/resistance is broken through, often indicating the start or continuation of a trend. Traders use breakout trading in several ways.
To start, we need to identify a support or resistance level. A common way is to look for relatively equal highs or lows forming, like in the chart above. When the level is broken with a strong impulsive move, traders may enter on the close of the breakout candle. However, if the move isn’t particularly strong, like at a), they could wait for a pullback. Traders can also place a stop order to enter as the pullback itself breaks out, as marked by the dotted lines.
Some traders place take-profit orders at an opposing support or resistance level. However, some may prefer to attempt to ride the trend and trail their stop loss above or below swing points as the move progresses. Similarly, stop losses might be placed above or below the nearest swing points.
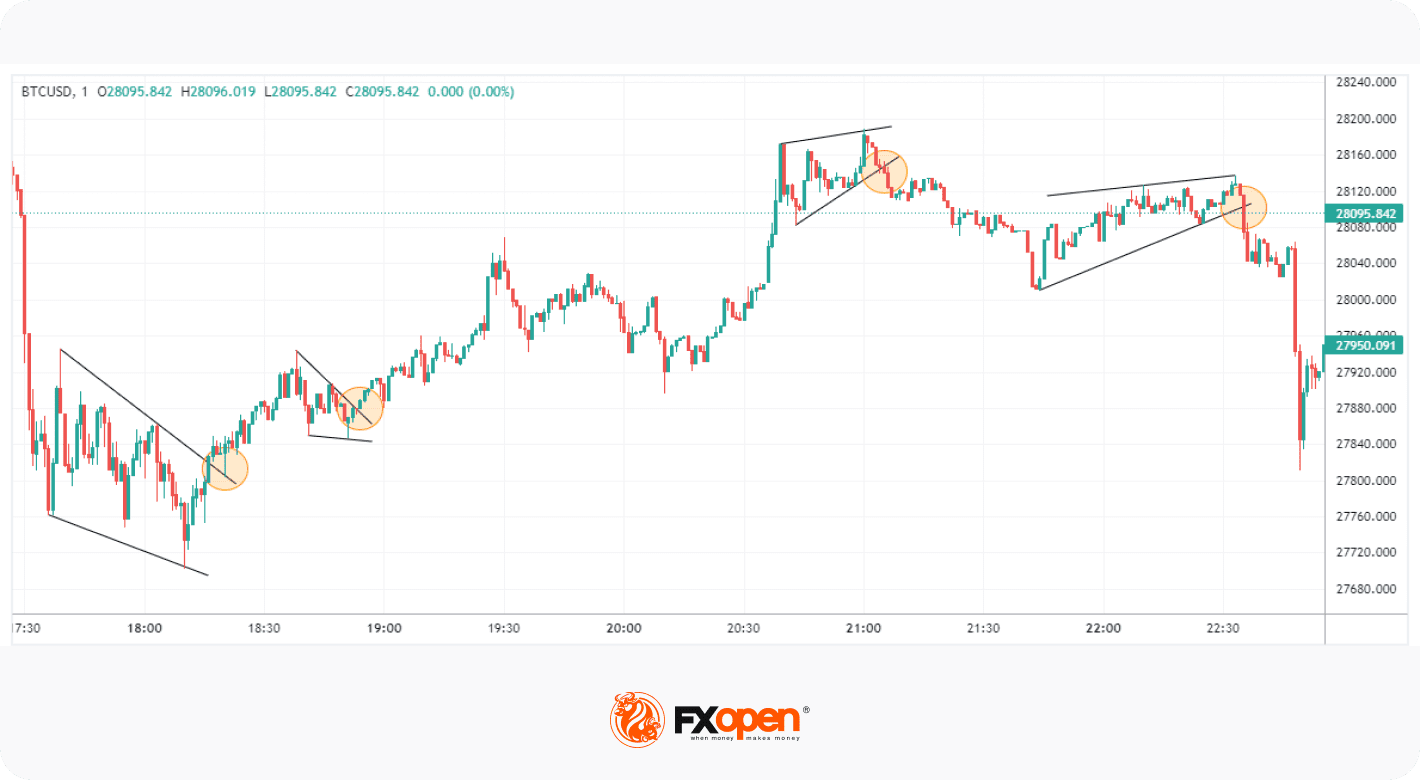
Chart patterns can be a powerful tool for scalping, helping traders to identify potential trend continuations and reversals. While there are many different chart patterns out there, some traders stick to just one or two to avoid confusion. We’ll use rising and falling wedges in this example, as they often lead to strong moves.
There are two ways to enter: either on the breakout or on the retest of the broken trendline. As you can see in the example, entering retests might be a more accurate method, but it’ll mean you miss out on some trades. Conversely, entering on the breakout is riskier, as it could just as easily be a false breakout.
A profit target and stop-loss level will depend on the pattern you’re using. Given that wedges typically prompt a prolonged trend, you could look for significant areas of support/resistance. For a more conservative approach, you might place a take-profit level at the most extreme point of the pattern. Likewise, stop losses might be set at the most extreme opposing point. For example, you might set a profit target at the high of a bullish wedge and a stop loss beneath its low.
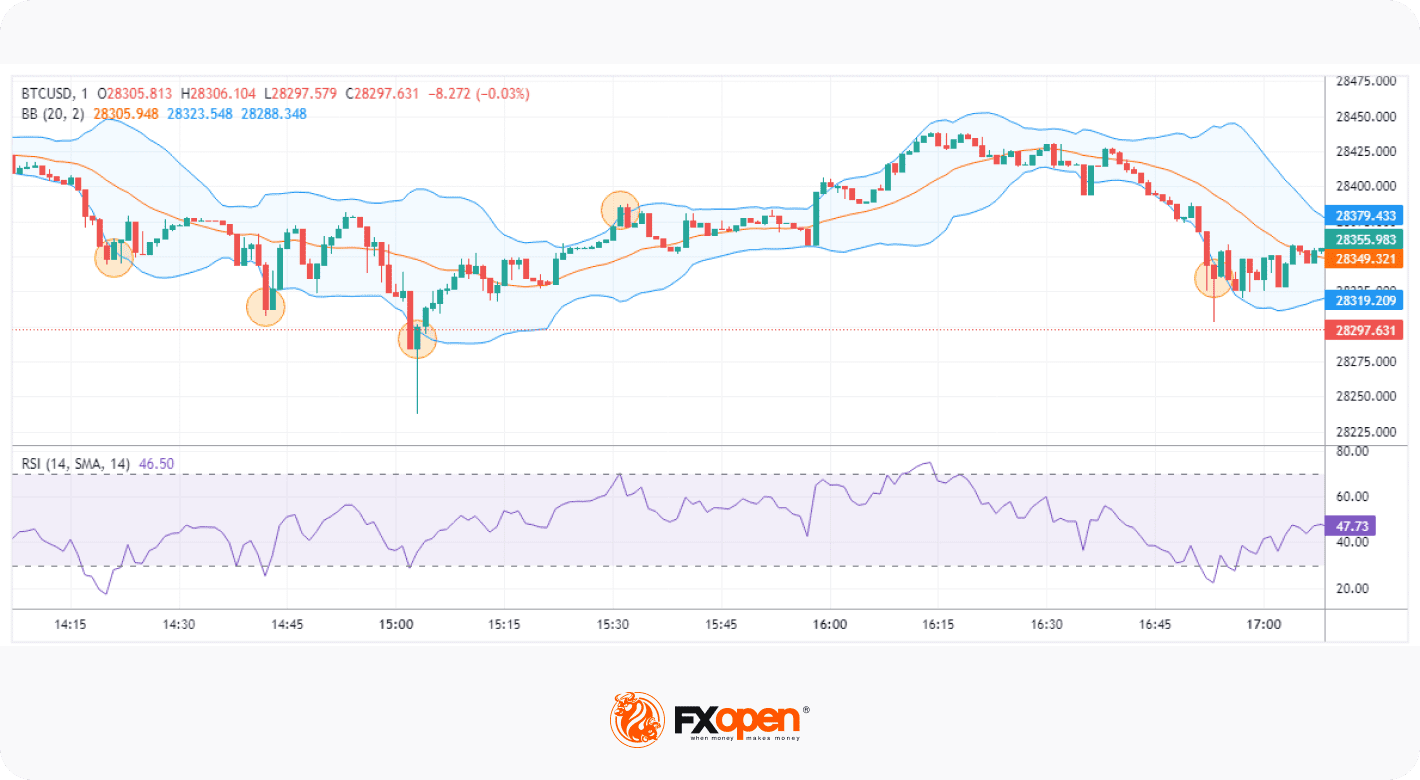
Some scalpers rely heavily on technical indicators to determine entries and exits. One popular combination is the relative strength index (RSI) and Bollinger Bands.
Relative Strength Index (RSI): The RSI measures the strength of price movements and can be used to identify overbought/oversold conditions and divergences. RSI can be particularly valuable for pinpointing short-term reversals.
Bollinger Bands: Bollinger Bands can identify periods of high or low volatility and potential price reversals with their standard deviations. Scalpers often look to short when price reaches the upper band and go long when it touches the lower band.
When RSI crosses 70, indicating overbought conditions, or below 30, showing the asset is oversold, traders can look to confirm a reversal entry with Bollinger Bands. If an asset is overbought and crosses above the upper band, a short position can be considered. If the asset is oversold and price breaches the lower band, a long position could be entered.
As for exit conditions, some scalpers may prefer to place a take-profit order at the midpoint of the Bollinger Bands or the opposing band. Others may close their trades when RSI crosses above or below 50, depending on the direction of trade. In terms of stop losses, they are often placed above or below a nearby area of support or resistance. Alternatively, traders choose a set distance for each trade.
At FXOpen, we offer both of these indicators in the TickTrader platform. There, you’ll also discover a whole host of additional indicators and tools ready to help you navigate the markets.
The bid-ask spread refers to the gap between the maximum price a buyer can offer (bid) and the minimum price a seller can accept (ask) for a specific asset. Scalpers may take advantage of the bid-ask spread.
When spreads are wide, traders place buy orders and sell orders simultaneously. They buy at the bid price and sell at the ask price, capturing the spread. This strategy is common for less liquid cryptocurrencies where spreads are naturally wider.
Now, it’s time to create your own scalping trading strategy for crypto! While your strategy will ultimately be unique to you and your preferences, you can try these steps to begin developing a system.
Of course, these steps aren’t exclusive to the crypto market. While scalping crypto may be preferable for some traders, you can also apply a similar strategy to the forex, commodity, and stock markets – you may just need to adjust it to suit these markets. Once you feel ready to deploy your strategy for real, you can consider opening an FXOpen account to gain access to hundreds of assets in our TickTrader platform.
*Important: At FXOpen UK, Cryptocurrency trading via CFDs is only available to our Professional clients. They are not available for trading by Retail clients. To find out more information about how this may affect you, please get in touch with our team.


