A Doji candle is a technical analysis tool that reflects periods of market indecision. It can provide insights when considered alongside other patterns or technical indicators. Traders often observe Doji candles when trading stocks, commodities, and currencies. This article explains the characteristics of Doji candlesticks and outlines the different types commonly seen on price charts.
A Doji is a pattern that consists of a single candle. It looks very different from other candlesticks; therefore, traders of any level of experience can determine it on a price chart. The Doji has a tiny body comprising equal or almost equal open and close prices and long shadows. What does a Doji candlestick mean? A short body informs traders about the indecision of buyers and sellers as none of them can drive the market. Long shadows reflect a market uncertainty. The longer the shadows, the more significant the market uncertainties.
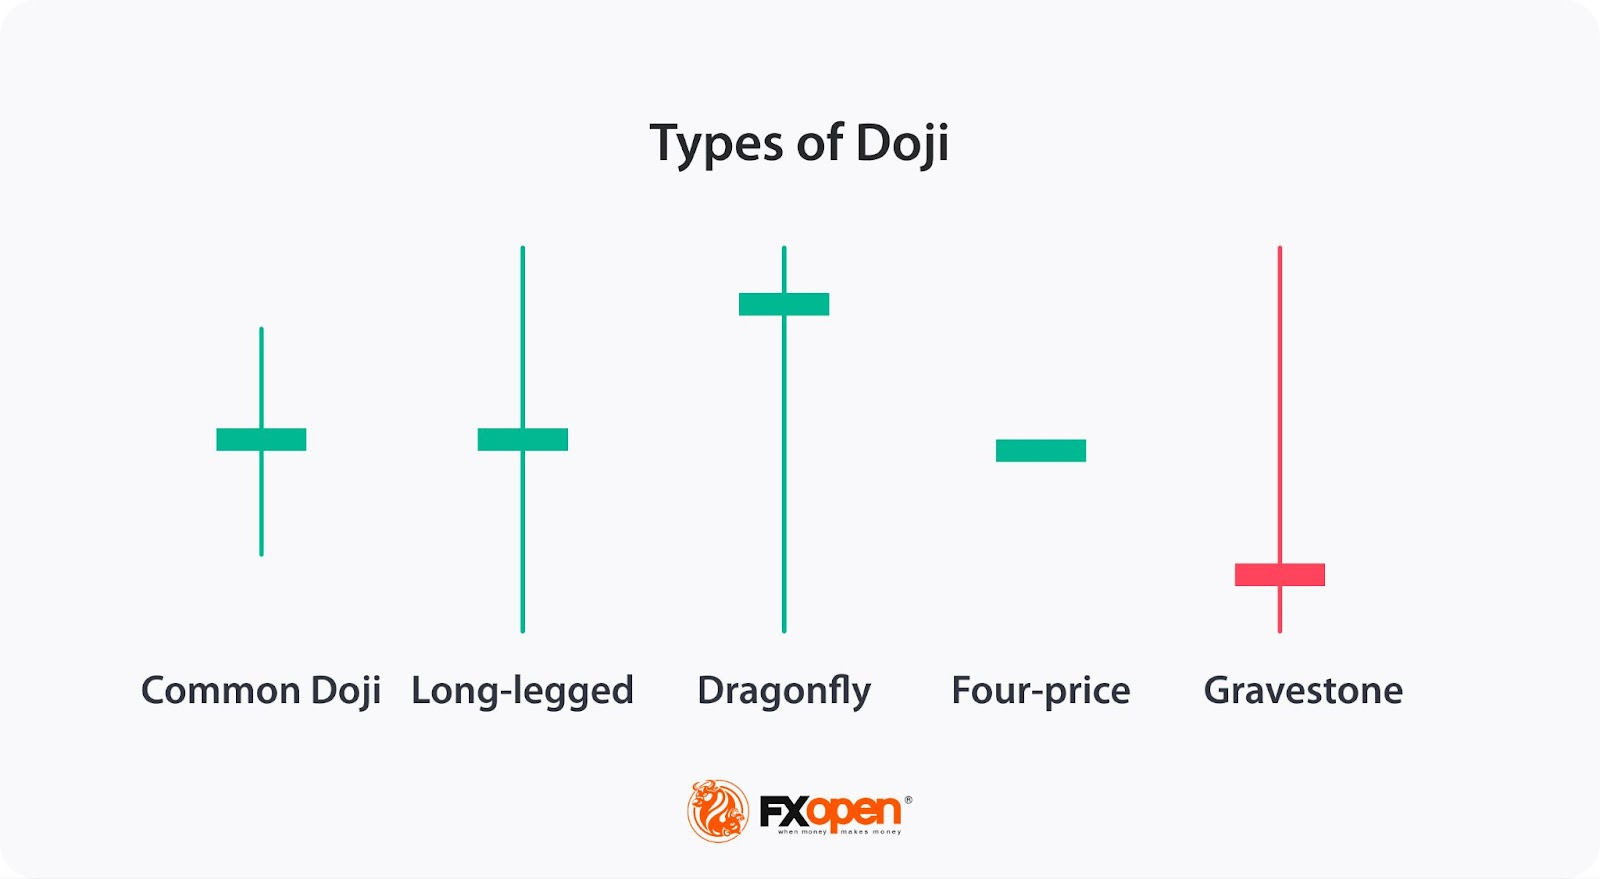
The most common types of Doji candles are standard, long-legged, Dragonfly, Gravestone, and four-price.
If you want to develop your own trading strategy based on Doji candles, you can consider heading over to the TickTrader trading platform.
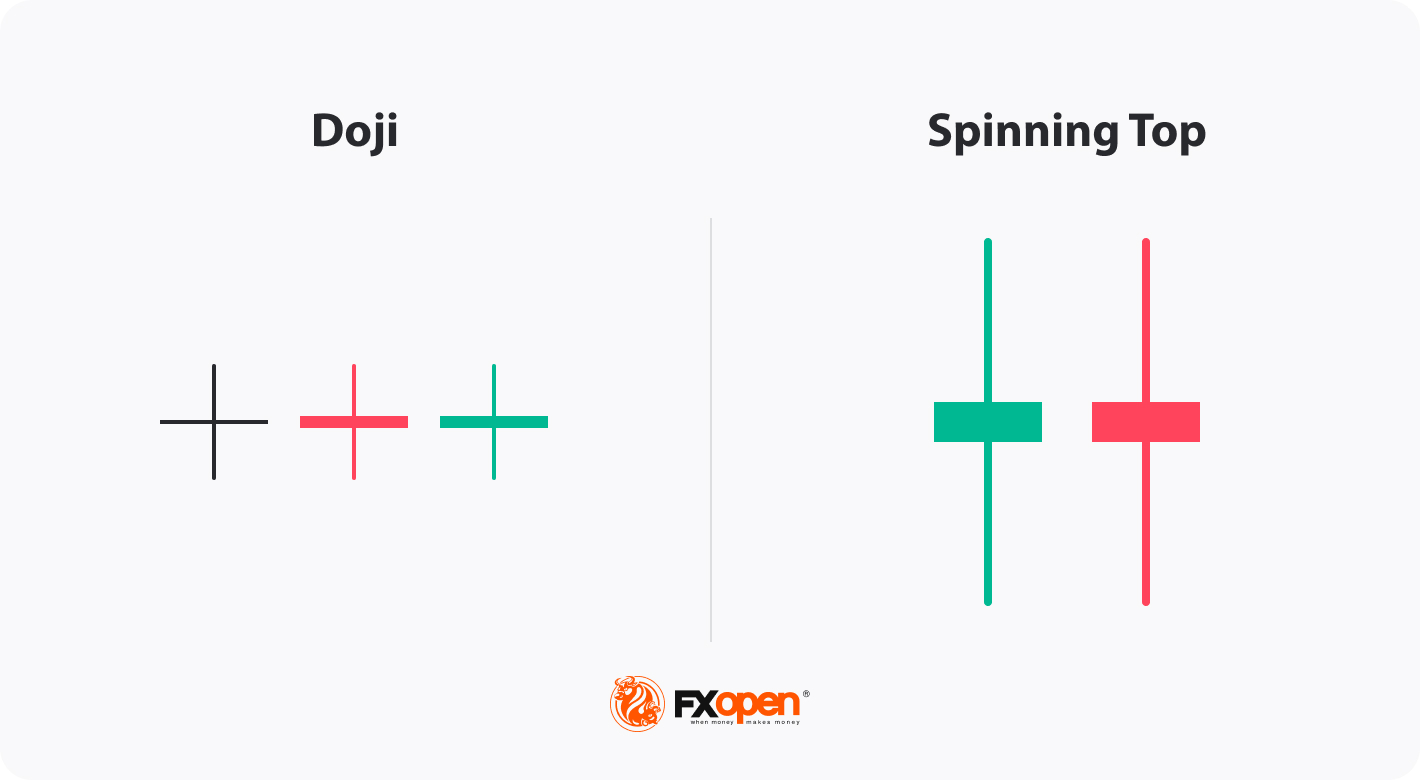
Traders may confuse Dojis with Spinning Tops as they look very similar. The theory suggests that Doji’s open and close prices are equal or nearly equal. Therefore, a Doji has a tiny body, so the difference between open and close rates is barely noticeable. A Spinning Top has a small body but the difference between the open and close rates is visible.
Traders may be caught in a trap if they rely solely on a Doji candle, meaning they need to combine Dojis with other technical tools to confirm its signals. These are some basic rules traders apply when reading a Doji candlestick pattern’s signs:
Trend strength. The first thing traders consider is the trend. Doji candles can appear before the continuation and reversal of a trend. If the market rises for an extended period, a newly formed Doji may be a sign of bull exhaustion. Conversely, appearing in a prolonged downtrend, it may signal an upcoming trend reversal. If the candle is visible in a newly formed trend, the trend will likely continue.
Additional indicators. If you find a Doji setup, it may be helpful to look for additional signals of other patterns or technical indicators. To confirm reversals, traders usually implement oscillators such as MACD, Stochastic, and RSI, which reflect overbought/oversold conditions, and indicators such as Average Directional Index that reflect the trend strength. Support and resistance levels can also be helpful when identifying trend reversals. The lack of a reversal confirmation may be a sign of a sideways movement or a trend continuation.
Timeframes. Doji candles can be observed across various timeframes, but their reliability increases in higher timeframes, such as the 4-hour, daily, or weekly charts. In these periods, Doji patterns hold more significance due to the larger sample of market data they encompass, reducing the noise found in shorter timeframes like the 1-minute or 5-minute charts.
Traders tend to use Dojis on these higher timeframes to capture key market reversals or trend continuations with more confidence. In contrast, Dojis on lower timeframes can be less dependable because they often form due to temporary price fluctuations and minor market indecision.
Broad market context. Understanding the broader market context is key when interpreting Doji candles. A Doji by itself provides limited insight, but when viewed within the larger market environment, its signals can become more meaningful.
The broader market sentiment can impact how Doji candles are interpreted. In a strong bull market, a bearish Doji candle may signal a temporary pause rather than a full reversal, especially if there is no significant change in overall sentiment. Similarly, in a bearish environment, a bullish Doji may suggest indecision but not necessarily a complete trend shift. Observing market news, events, or fundamental data can provide additional clues about the market’s direction.
Major economic reports, interest rate decisions, and geopolitical developments can influence the formation of Doji candles. For instance, during the release of critical economic data, Doji patterns may appear as traders hesitate to commit to a direction until the news is fully digested. Traders often avoid making decisions based on Dojis during such high-volatility periods, preferring to wait for the market to settle before drawing conclusions.
Trend phase. A Doji’s reliability also depends on the phase of the trend. In a well-established trend, Dojis can serve as a signal of market exhaustion, suggesting a possible reversal or slowdown. However, during periods of consolidation or ranging markets, Dojis might simply indicate ongoing indecision, reflecting sideways price action without any imminent breakout.
Dojis can be found in different market conditions and their signals will vary significantly.
A Doji can appear in up- and downtrends.
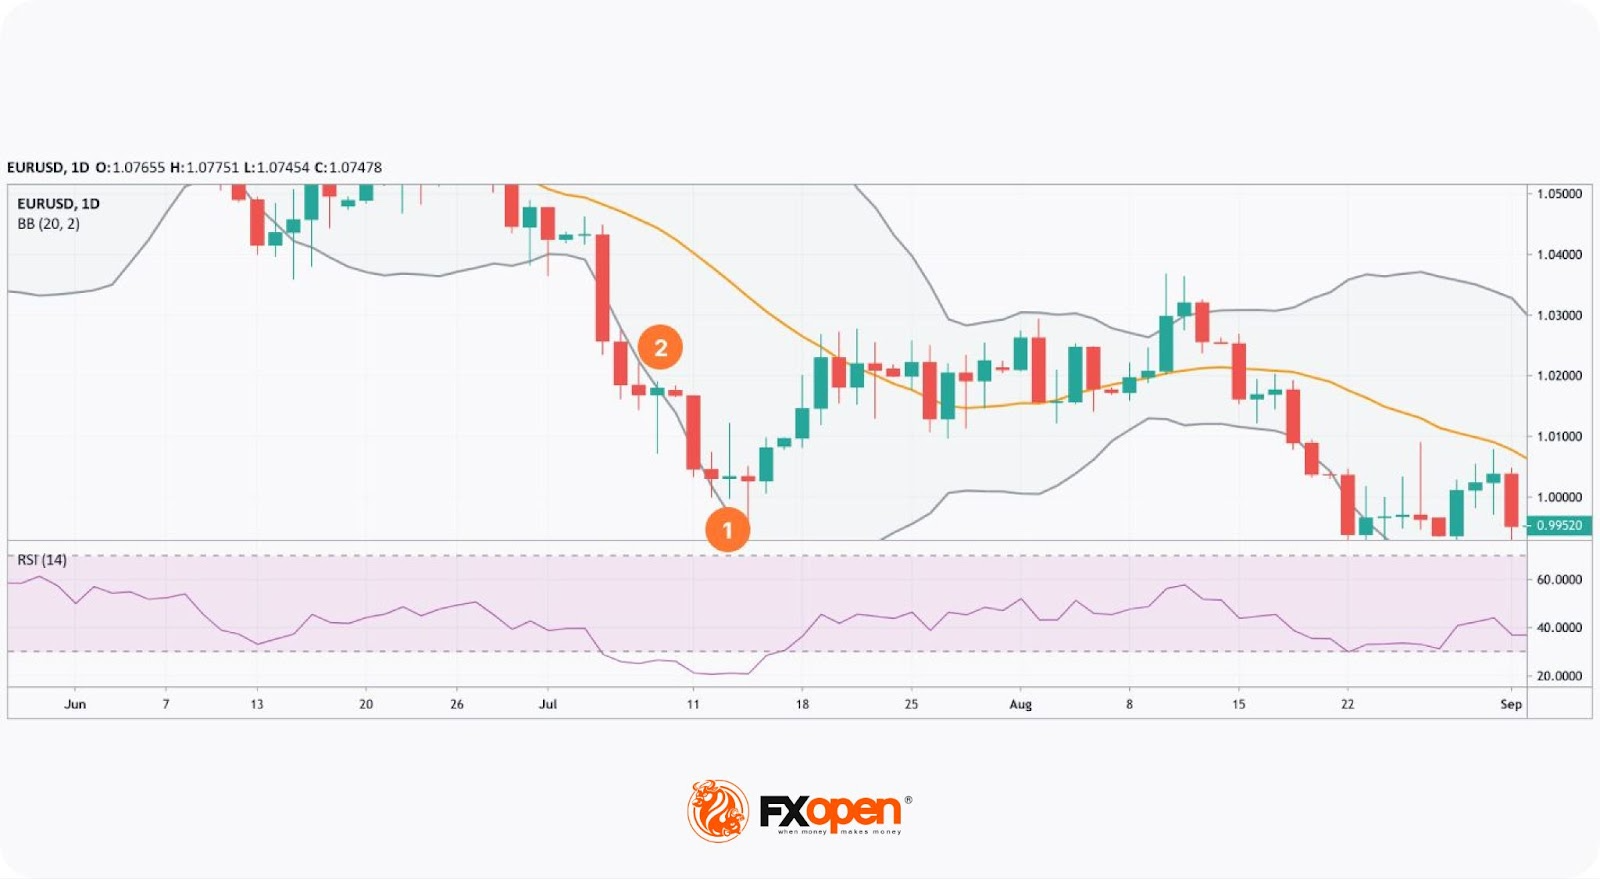
On the chart above, the EUR/USD pair formed a spinning top and two forex Doji candlesticks, a Gravestone and a Dragonfly at the end of a downtrend (1). At that time, the RSI indicator was in the oversold area, and the pair was near the lower band of the Bollinger Bands indicator. After, the market turned around.
However, if you have noticed, there was another Dragonfly Doji several candles ahead (2). Then, the RSI indicator was also in the oversold area, and the price was near the lower band of the Bollinger Bands indicator. You could wait for the RSI to leave the oversold zone to avoid a losing buy trade.
The previous example can be used to explain another standard theory that a more significant number of Dojis results in a more reliable signal. However, while the last example confirms the theory, another refutes it.
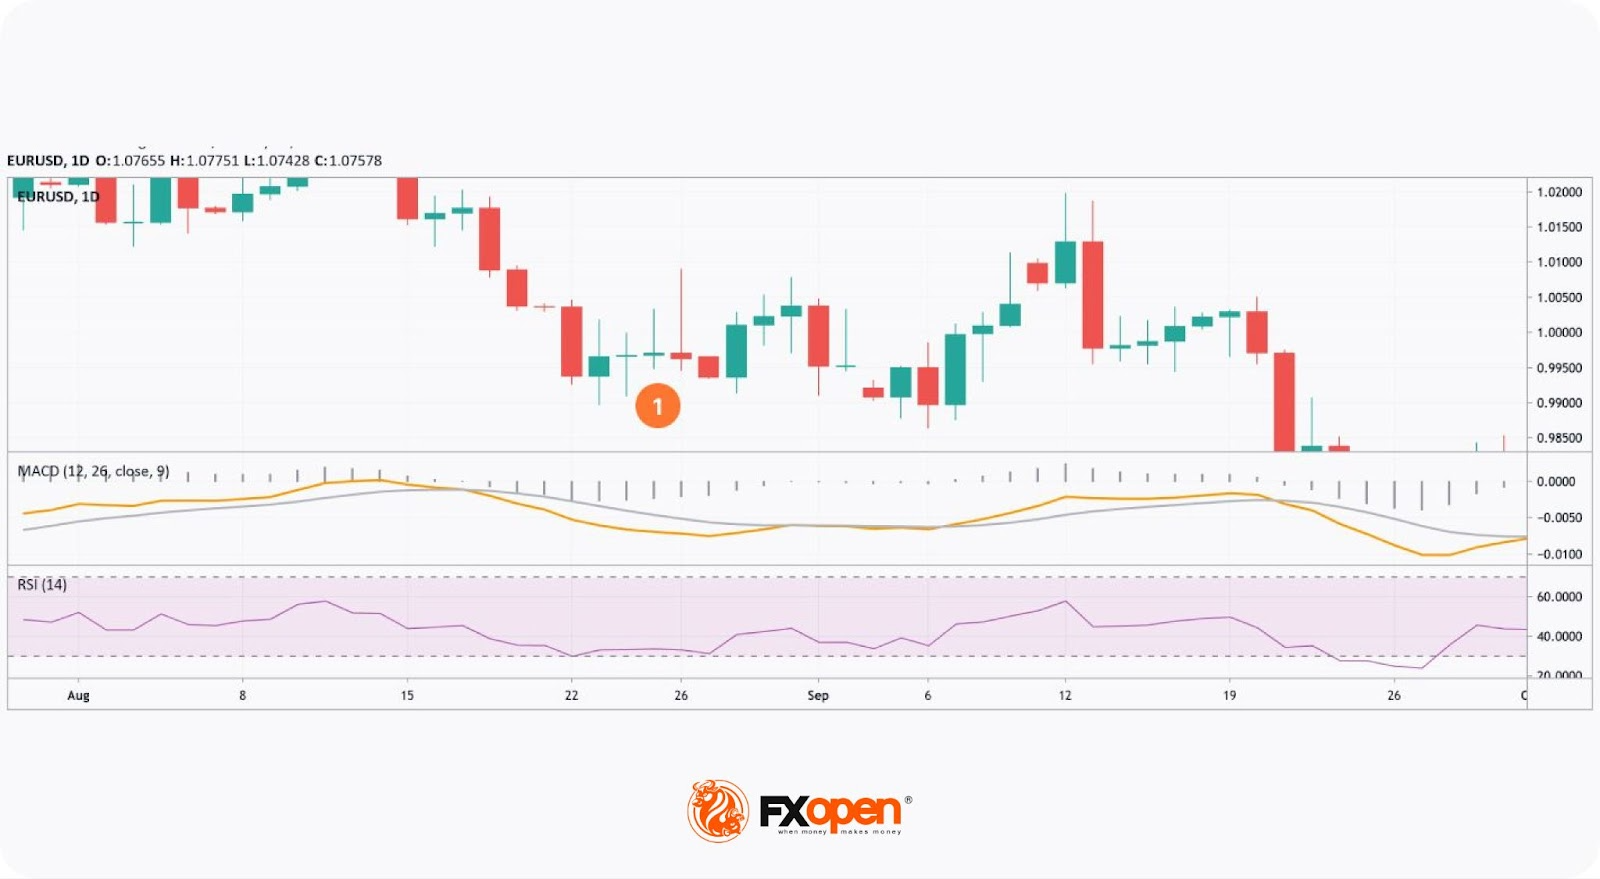
On the chart above, there are three Dojis — long-legged and two Gravestones (1), formed after a downtrend. However, their appearance didn’t lead to a trend reversal — it was a medium-term consolidation ending with a continuation of a downtrend. The consolidation was confirmed by the lack of signals from common trend reversal indicators — the MACD and the RSI.
While Doji candle patterns can be useful in trading, there are several common mistakes traders make when interpreting them. Here are some pitfalls to avoid:
A Doji isn't a common instrument to determine market direction. Still, it may be used as a barometer of the market sentiment that may lead to particular price movements. The theory suggests that traders do comprehensive analysis and combine Dojis with other technical tools before they enter or exit the market.
To implement the Doji pattern in stock, commodity, or currency trading, you may consider opening an FXOpen account and trade with low commissions from $1.50 per lot and tight spreads from 0.0 pips.
A Doji candle signals market indecision, as the opening and closing prices are nearly identical. It often represents a balance between buyers and sellers, leading to a potential reversal or continuation depending on the broader market context and trend.
A Doji candle is neither inherently bullish nor bearish. Its interpretation depends on its position within a trend. In an uptrend, it may suggest a bearish reversal, while in a downtrend, it could signal a bullish reversal. In either scenario, it may also signal a period of market indecision.
In a downtrend, a Doji often signals that the sellers are losing strength, hinting at a potential bullish reversal. However, confirmation through other technical indicators is often sought before acting on this signal.


