Recurring market structures are one of the critical parts of technical analysis. The ascending channel is a classic pattern that reflects steady upward movement. In this article, we break down the structure of ascending channels, their trading implications, and how traders may use them to identify price direction.
An ascending channel is a common pattern on price charts. Also known as a rising channel pattern or an upward channel pattern, this formation can be found primarily in the uptrend. It is characterised by two parallel lines. As the price of an asset moves higher over time, these two lines are formed by connecting higher highs and lows, creating boundaries that the price interacts with.
According to the theory, ascending channels mark a period of consolidation in a bullish trend, after which an upward breakout is expected to occur. However, a breakdown may happen. Also, in some cases, we can see the pattern in a downtrend, where the price can also break out in any direction.
There are three types of channel patterns: ascending, descending, and rectangular. The ascending channel is different from the plain rectangle formation in the way that it slopes to the upside, while a rectangle is a horizontal range. At the same time, it differs from the descending pattern in that the falling channel slopes to the downside.
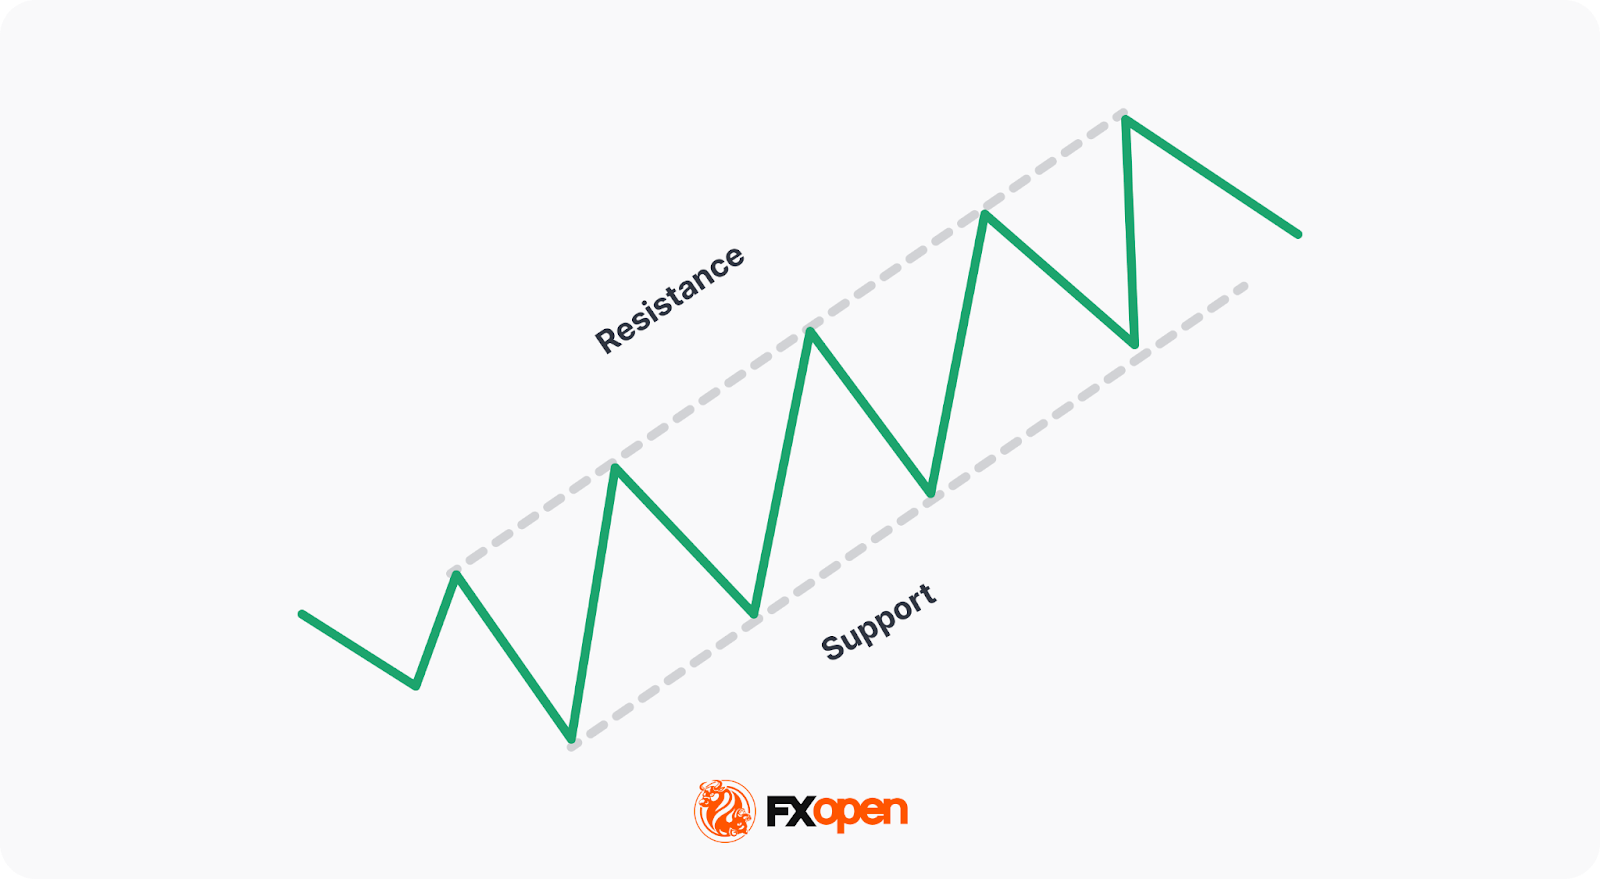
To construct the formation, traders need to identify at least two highs and two lows. Traders typically connect these two points with a trendline, which is then used as the basis for the channel pattern. The first line is drawn by connecting higher highs, while the second line is drawn by connecting higher lows. The channel is in place as long as the price remains within it and continues moving higher over time.
Now let's look at some charts on our TickTrader trading platform and see if we can find some examples of this formation.
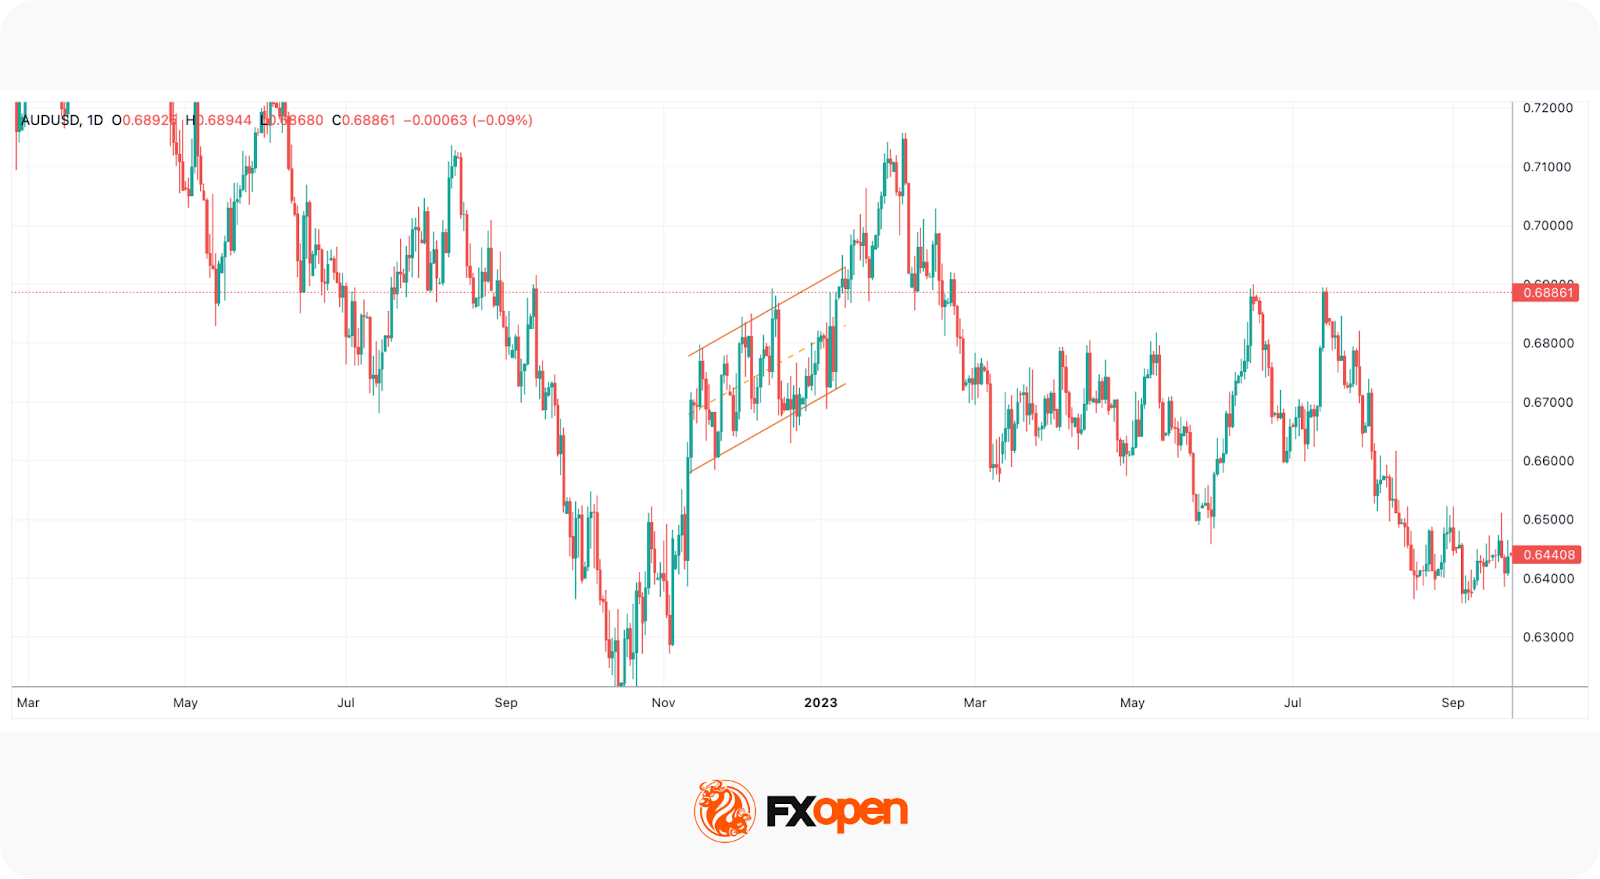
The daily chart of the AUD/USD pair shows that after an impulsive move to the upside, the price started consolidating before the uptrend continued. This brief pause in the trend is the rising channel.
It can be drawn out manually with the use of a trendline tool; however, you can utilise the “Parallel Channel” tool that also shows the median line of the range. This can be useful in trading according to the mean reversion strategy.
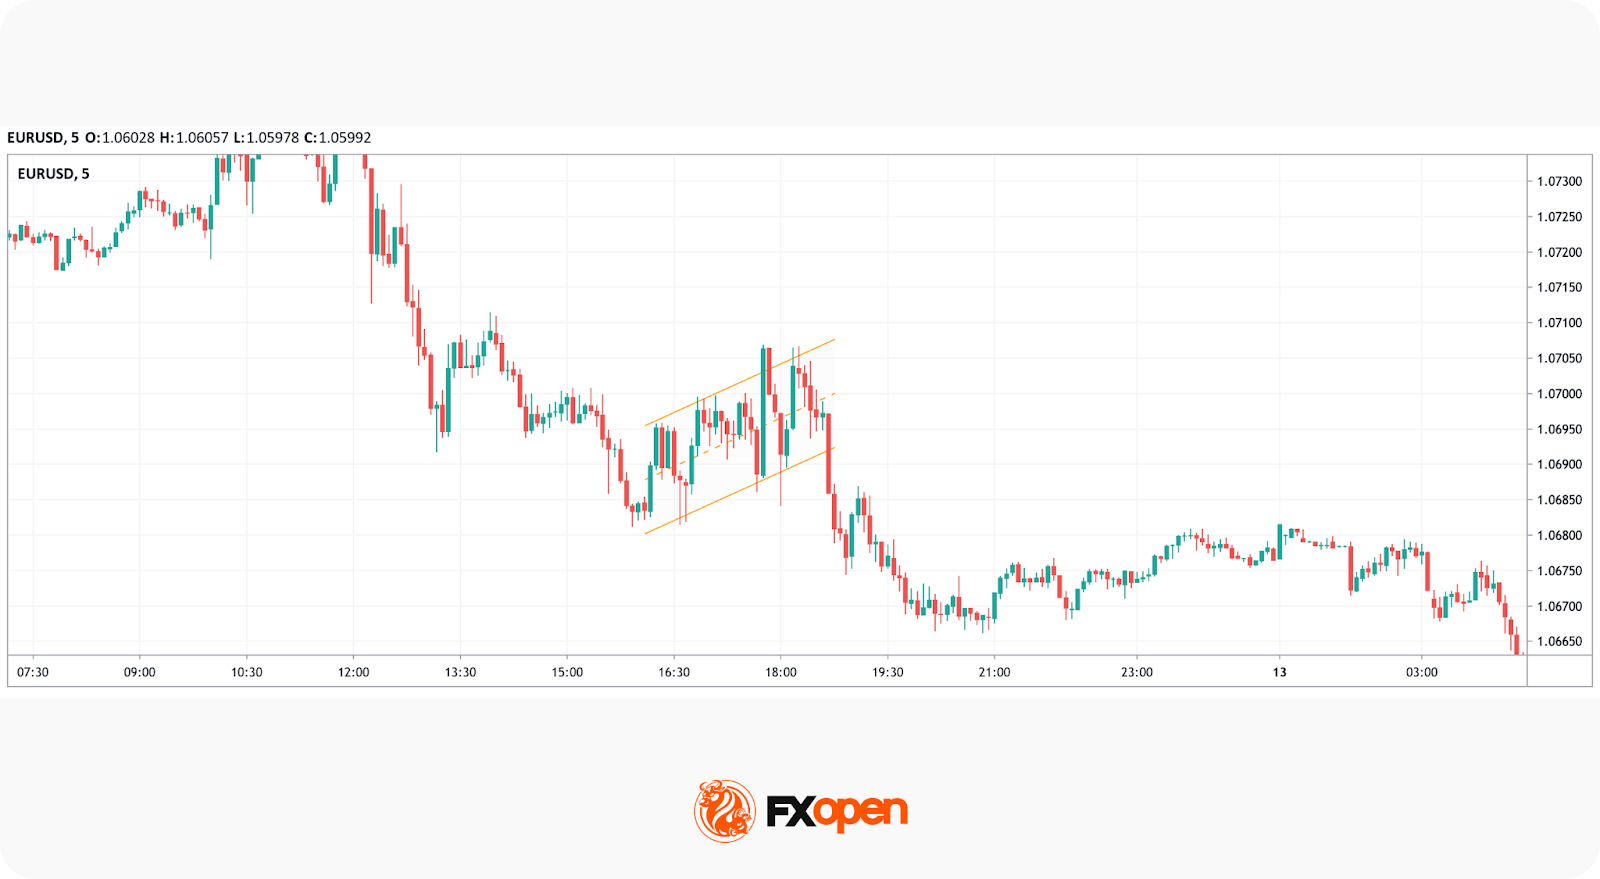
As it was stated, it can also appear in a downtrend, indicating further downtrend continuation after it completes.
There are two main approaches when it comes to trading.Mean Reversion
The first one is the mean reversion strategy which involves trading the range itself. The second one is waiting for a breakout and catching a trend continuation or reversal.
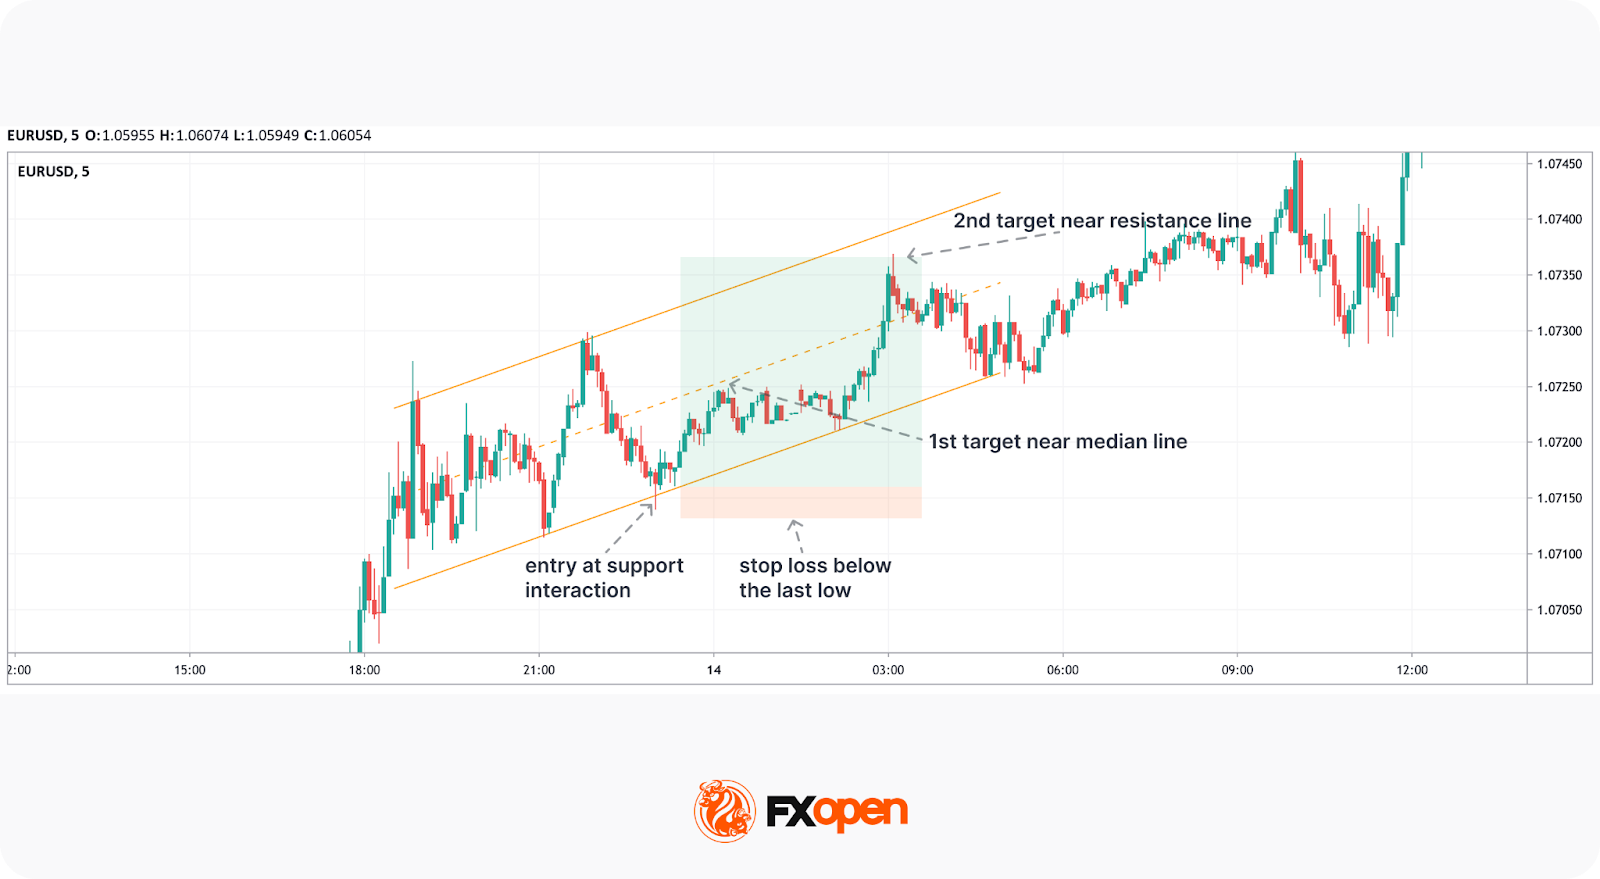
In the case of mean reversion, the general rule is that entries are made when the price touches or approaches either boundary of the rising channel, with buy positions taken at support (the lower trendline) and sell positions at resistance (the upper trendline). In terms of risk management, a stop-loss might be placed just outside the channel boundary, below the lower trendline in the case of a long position or above the upper trendline in a short position.
Profit targets might be set at the median line of the bullish channel pattern, as this represents a key level where the price often retraces. Some traders choose to trail their stop-losses as the price moves toward resistance or support, locking in the trade if the price continues in their favour. Alternatively, traders hold the position until the price touches the opposite boundary, maximising potential gains within the channel.
A more popular technique is the ascending channel breakout. This involves waiting for the price to break through one of the boundaries. The direction of the breakout can also provide important information about the trend, as a break to the downside may indicate a bearish reversal in an uptrend or a continuation in a downtrend, while a break to the upside may indicate bullish momentum.
Considering that the price was in a range and there could be false breakouts, it is important to wait for a breakout confirmation before entering a trade.
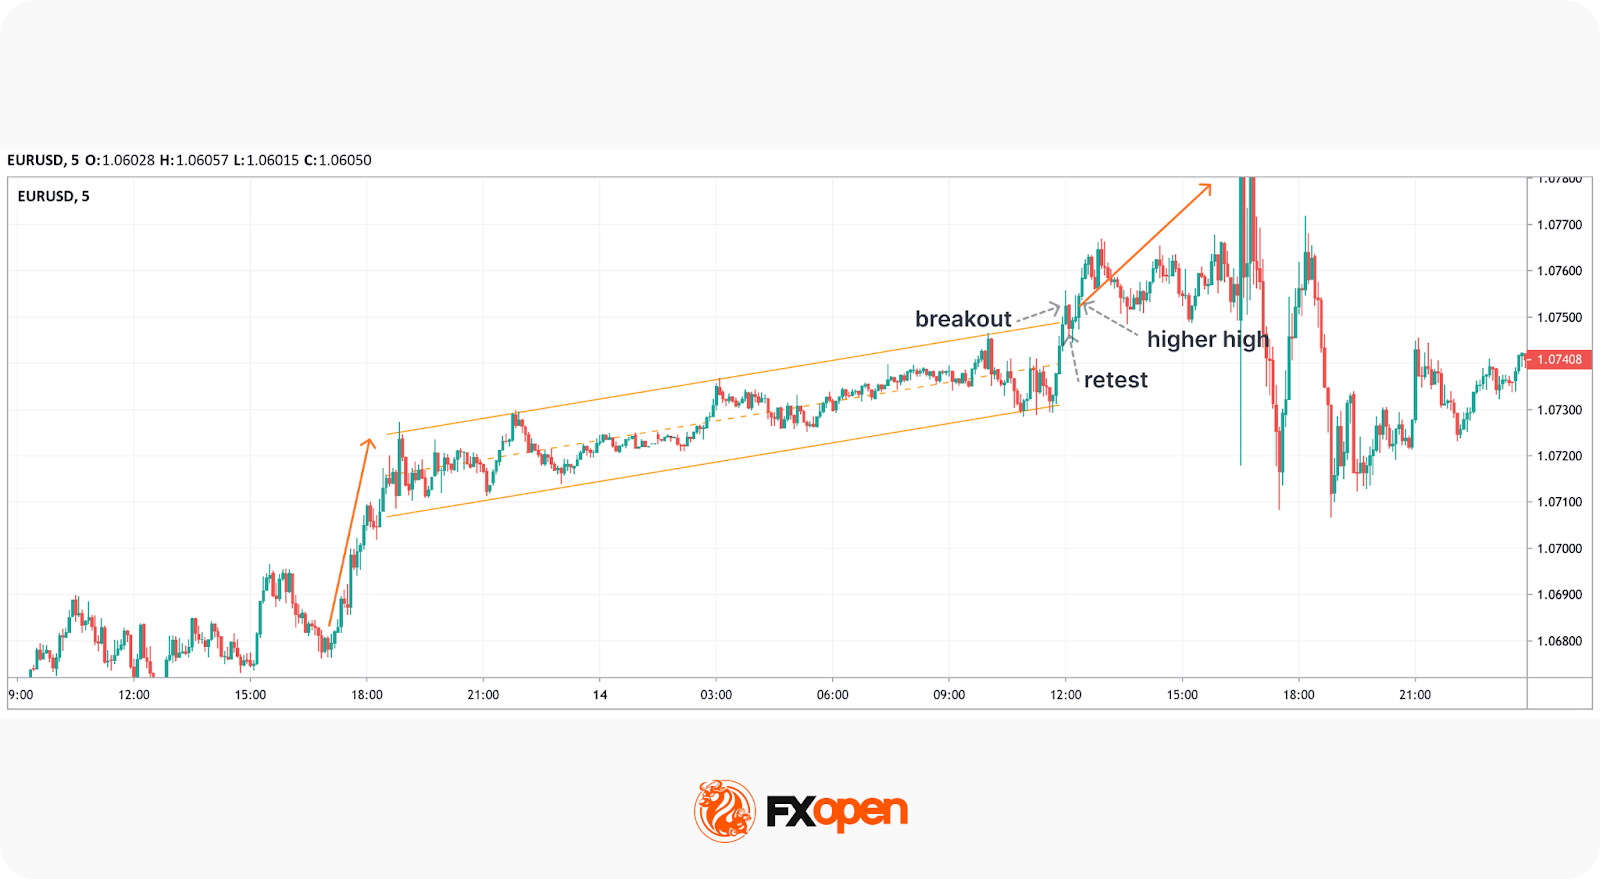
A breakout is confirmed by three points. First, the price needs to surpass the boundary. Second, it needs to retest the boundary. Finally, a trade can be opened on the third confirmation, which comes in the form of a price surpassing the breakout high in an upward movement and the breakout low in a downward movement. Only then can we be sure that a breakout is confirmed and enter a trade with confidence.
The theory states that a stop-loss level can be placed below the upper trendline in a bullish breakout and above the lower trendline in a bearish breakout. An ascending channel pattern target for profit taking may be calculated by projecting the length of the previous move before the setup formed to the breakout point.
Confirmation tools are used to verify potential trades within an ascending channel pattern. Below are specific tools that can be used to confirm entries and exits when trading channel patterns:
The upward channel pattern, while useful, carries several risks and limitations that traders consider before relying on it for decisions.
The ascending channel pattern is a versatile technical analysis tool that some traders use to identify trends and make decisions when trading in different markets, including forex, commodities, and stocks. Regardless of the level of experience, an understanding of the ascending channel pattern may help traders build a trading strategy.
If you want to trade now, you can consider opening an FXOpen account to catch spreads from 0.0 pips and enjoy low commissions from $1.50 per lot. Good luck!
An ascending channel is a chart pattern formed by two upward-sloping parallel lines, representing higher highs and higher lows. It typically indicates a bullish trend, but the price can break out in either direction, signalling a continuation or reversal of the trend.
The ascending channel is primarily bullish, as it shows an upward trend. However, a breakout below the lower boundary can signal a bearish trend, while a breakout above the upper boundary suggests continued bullish momentum.
Identifying an ascending channel starts with connecting at least two higher highs and two higher lows with parallel trendlines. The price should remain within the boundaries, so traders can enter long positions at support and short positions at resistance. Another trading rule is to trade breakouts. Breakouts are typically confirmed before entering trades.
An ascending channel slopes upward and signals bullish conditions, while a descending channel slopes downward, indicating a bearish trend. Both patterns form parallel boundaries, but the price direction and trend bias differ significantly between the two.

