
The moving average (MA) is one of the most widely used tools in technical analysis. Traders rely on it to identify market trends and their reversals. Among the various types of moving averages, the exponential moving average, or EMA, stands out.
Unlike a simple moving average, the EMA gives more weight to recent price data, making it more responsive to market changes. In this article, we’ll discuss what an exponential moving average is, how the EMA works, how to calculate it, and how it may help traders determine upcoming price movements.
So, what does EMA mean? An EMA (exponential moving average) is a moving average that gives more weight to recent market data, making it more responsive to price changes than a simple moving average (SMA). Like other MAs, it’s used by traders to identify trends in various financial markets, including forex, stocks, commodities, and cryptocurrencies*.
The EMA smooths out fluctuations by calculating the average price over a specific period, but it applies a multiplier that places greater emphasis on recent data. This makes it particularly useful for detecting short-term trends and reacting quickly to sudden market movements. Traders often use different timeframes for EMAs, such as 10, 50, or 200 periods, depending on their trading strategy and the asset they are analysing.
The indicator’s primary advantage is its responsiveness, which may help traders make decisions in fast-moving markets. Exponential moving averages are used to identify a trend direction. Also, they can be used to spot potential support and resistance levels, with prices often bouncing off these levels during upward or downward movements.
EMA Formula
Trading platforms like TickTrader have an exponential moving average indicator that you can automatically apply to your charts. However, it is useful to know how to calculate an EMA to understand its signals.
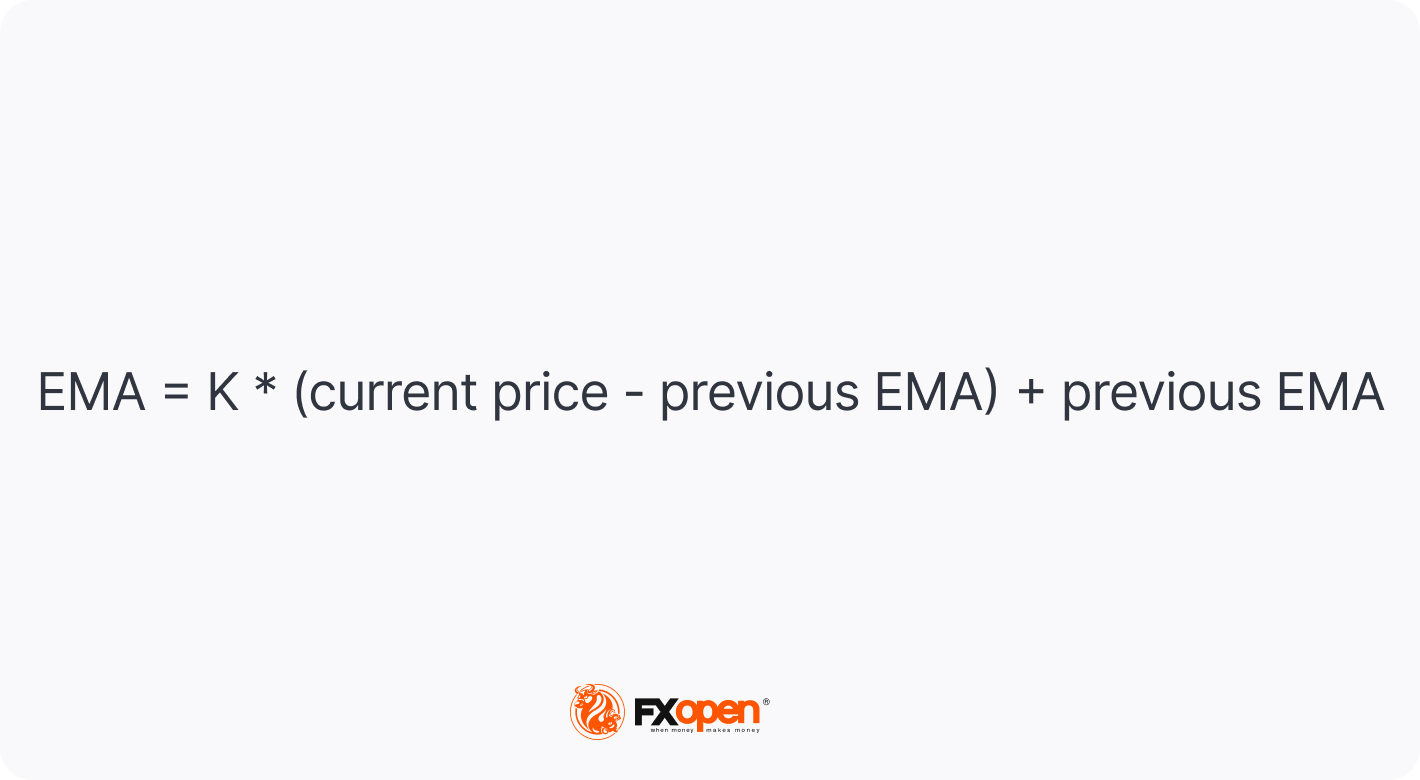
You can find EMA calculators on the internet or use an Excel document to do this manually. The exponential moving average formula is the following:
1. Calculate the weighting multiplier (K) by taking 2 divided by the number of periods plus 1.
2. Calculate the EMA by subtracting the previous period’s EMA from the closing price, multiplying it by K, and then adding the previous EMA.
The main difference between a simple moving average (SMA) and an exponential MA is determined by their formulas. The simple moving average is calculated by taking the arithmetic mean of a set of prices. For instance, to calculate the 10-day SMA for a stock, you add up the closing prices of a stock over the last 10 days and divide the total by 10.
Although this is easy to calculate and understand, the SMA has limitations in that each data point is given equal weight, regardless of how old it is. This means that the SMA tends to be slow to react to sharp price movements, which can put traders at a disadvantage in volatile markets.
In contrast, by adding a weighting multiplier, EMA technical analysis is more responsive and may be better suited to trading in volatile markets or on short-term timeframes. The EMA is very popular among traders who favour short-term strategies, such as day trading.
Below you can see how SMA and EMA interact with prices.
What is the EMA used for in practice? The exponential moving average provides three key signals: identifying trend direction, highlighting potential support and resistance levels, and indicating possible buy or sell signals. You can apply the indicator to all financial markets, including forex, stocks, commodities, and cryptocurrencies*.
This greater weight given to recent data is useful when analysing volatile markets, where there may be abrupt changes in the price. This is particularly useful if you are trading intraday or highly volatile assets.
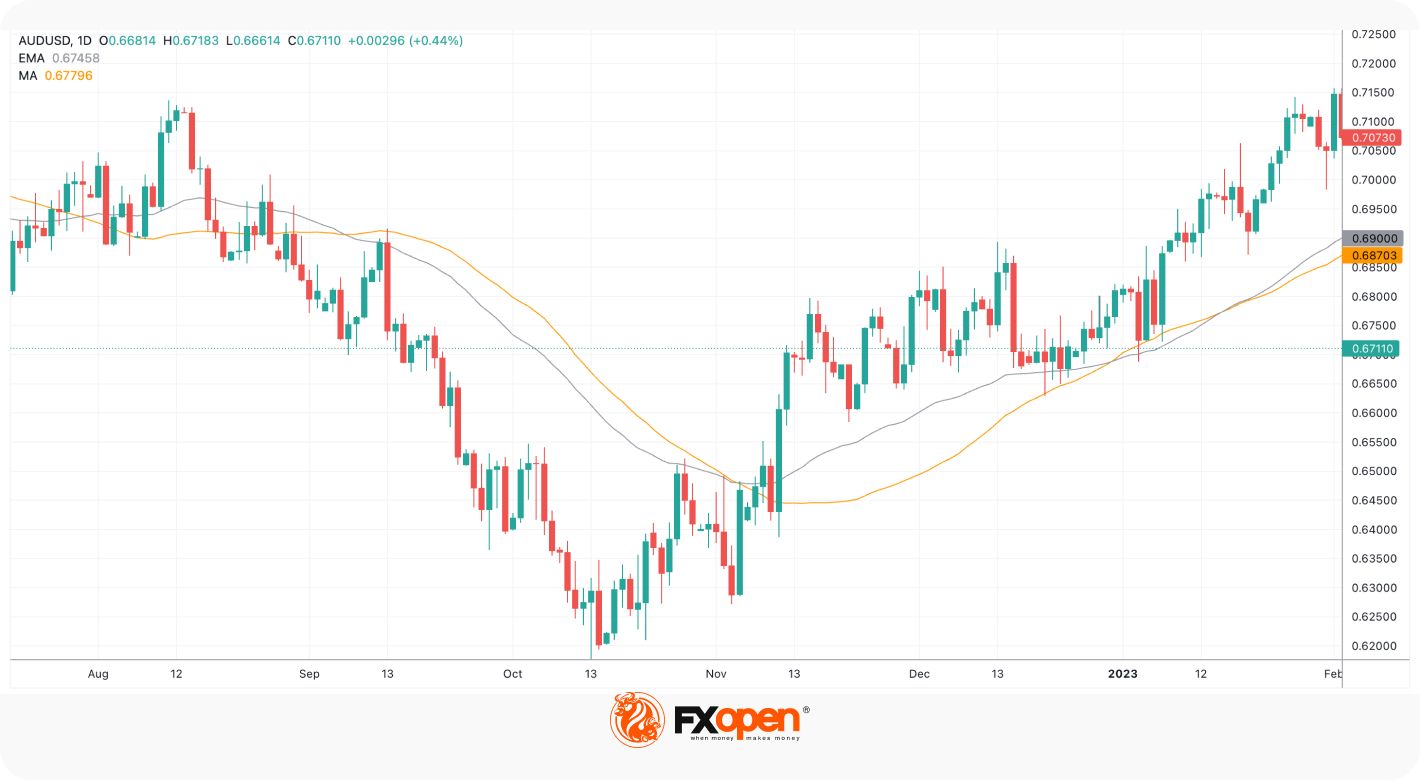
If the exponential MA slopes higher, it suggests that the asset is in an upward trend. When the price crosses above the EMA line (1), it is considered a bullish signal, indicating that the asset could continue rising.
If the indicator slopes downward, it indicates the price is falling. When the price moves below the line (2), it is a bearish signal indicating that the asset could fall further, and you might use this as a sell indicator.
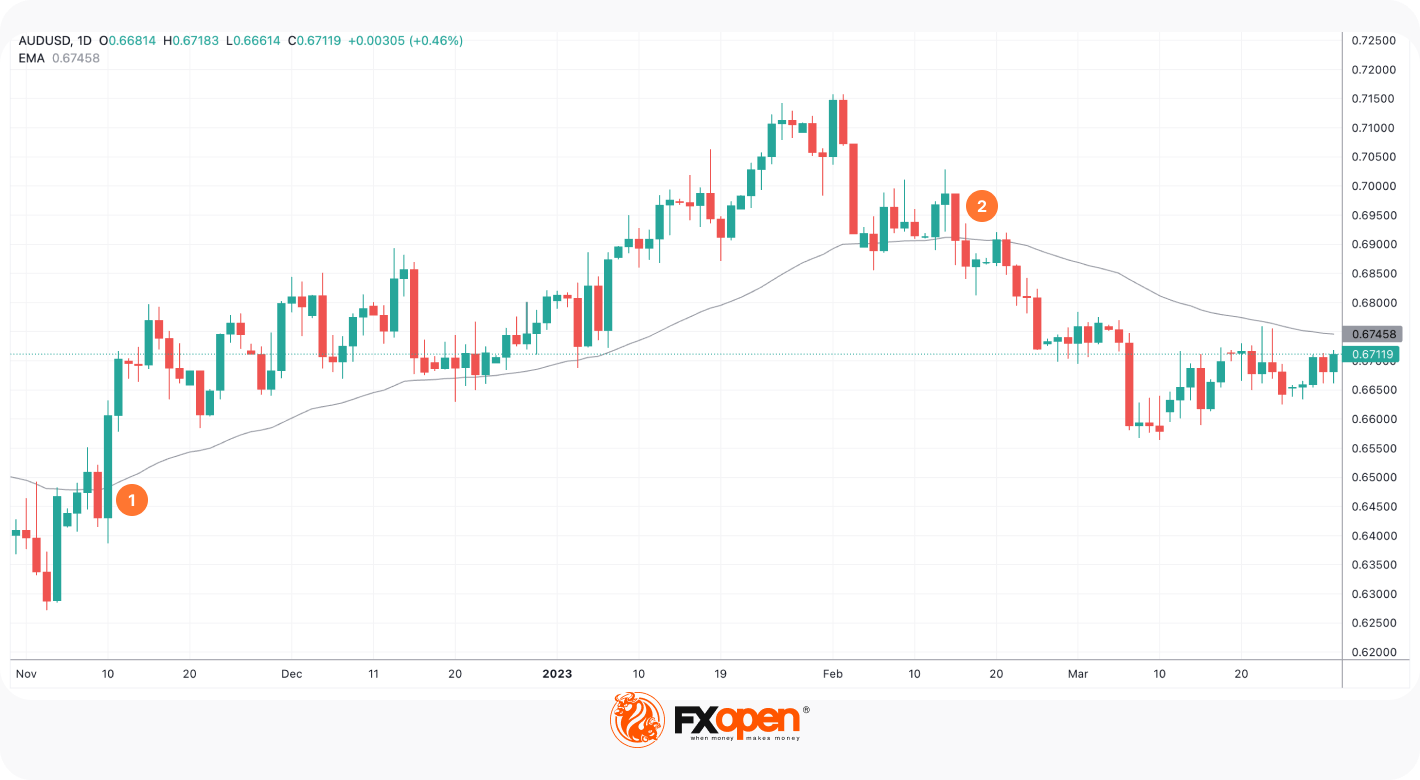
The exponential MA may help you identify support and resistance levels. When the line is below the price in an upward trend, it serves as support, and when it is above the price in a downward trend, it serves as resistance.
If it has been acting as support for the price, you could buy when the price reaches the line believing that it will rebound and move higher. Conversely, if the EMA acts as resistance, you can sell the asset when the price reaches the line, expecting the price to bounce off the EMA.
The chart shows a price initially rebounding off the EMA as resistance. This is followed by the point at which the price rises above the resistance level, with the line becoming a support level at which the price bounces off.
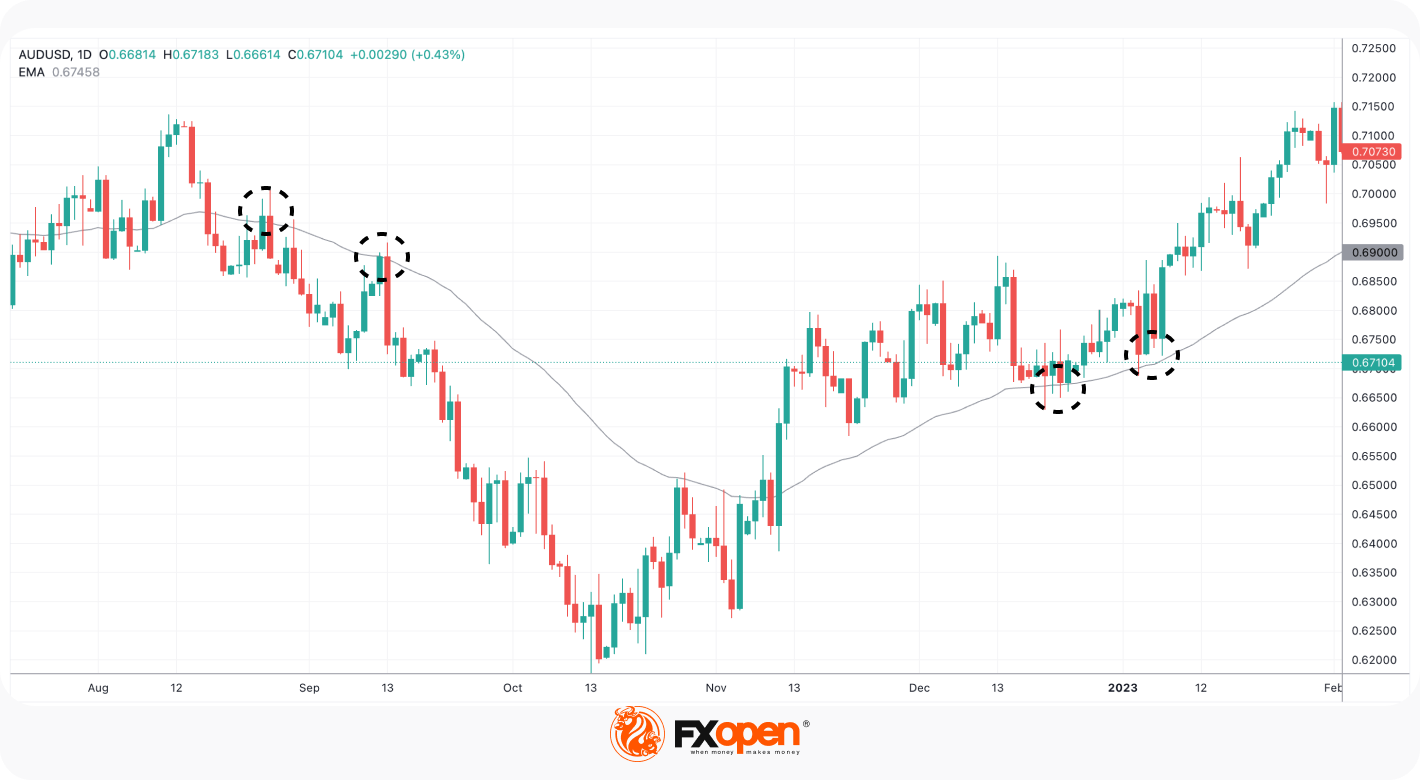
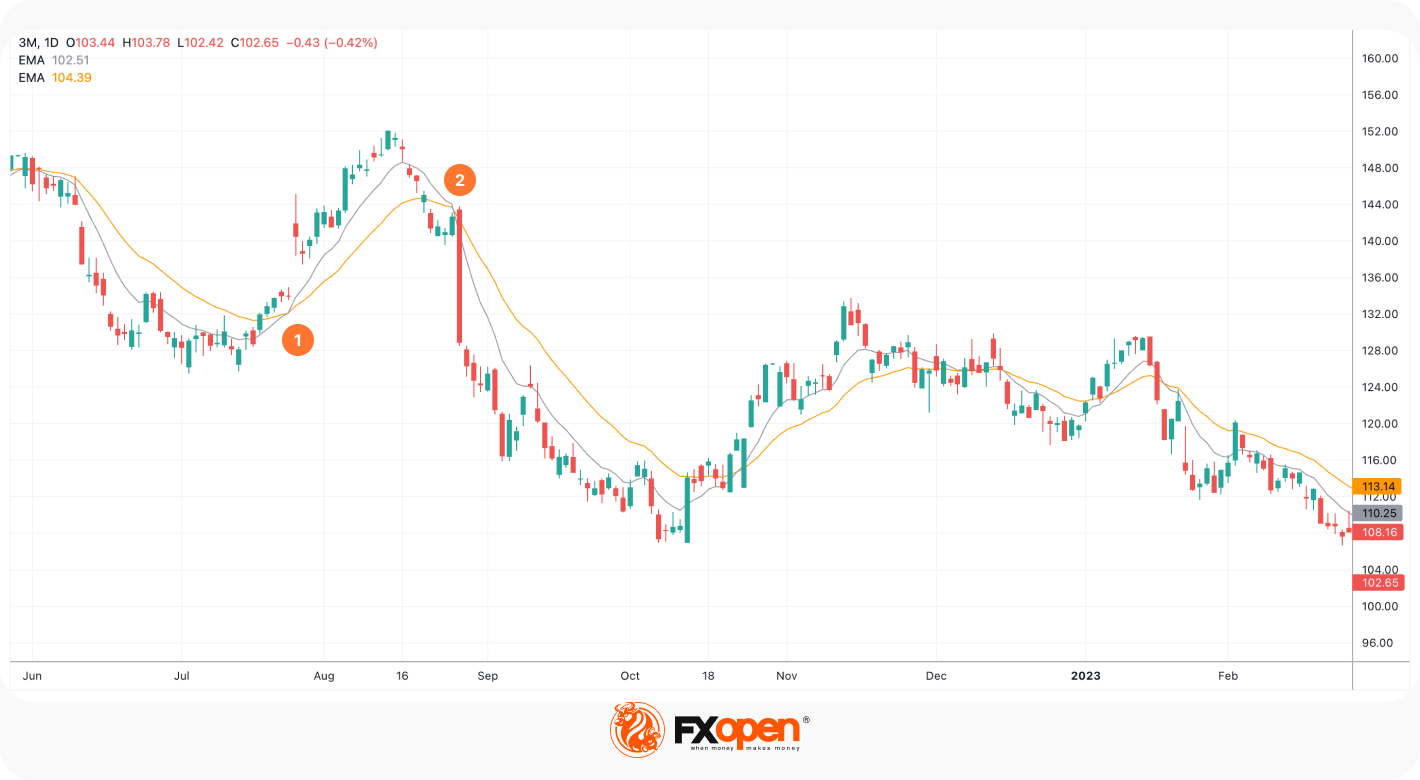
Crossovers of the exponential MA lines from different periods also give buy and sell signals. For instance, if a shorter-term EMA line for a stock crosses above a longer-term line, this is considered a bullish signal when using the EMA in stocks, and you might consider opening a long position (1). This is a so-called golden cross. Conversely, a shorter-term average crossing below the longer-term is considered a bearish signal, and you might consider selling (2). This is a death cross.
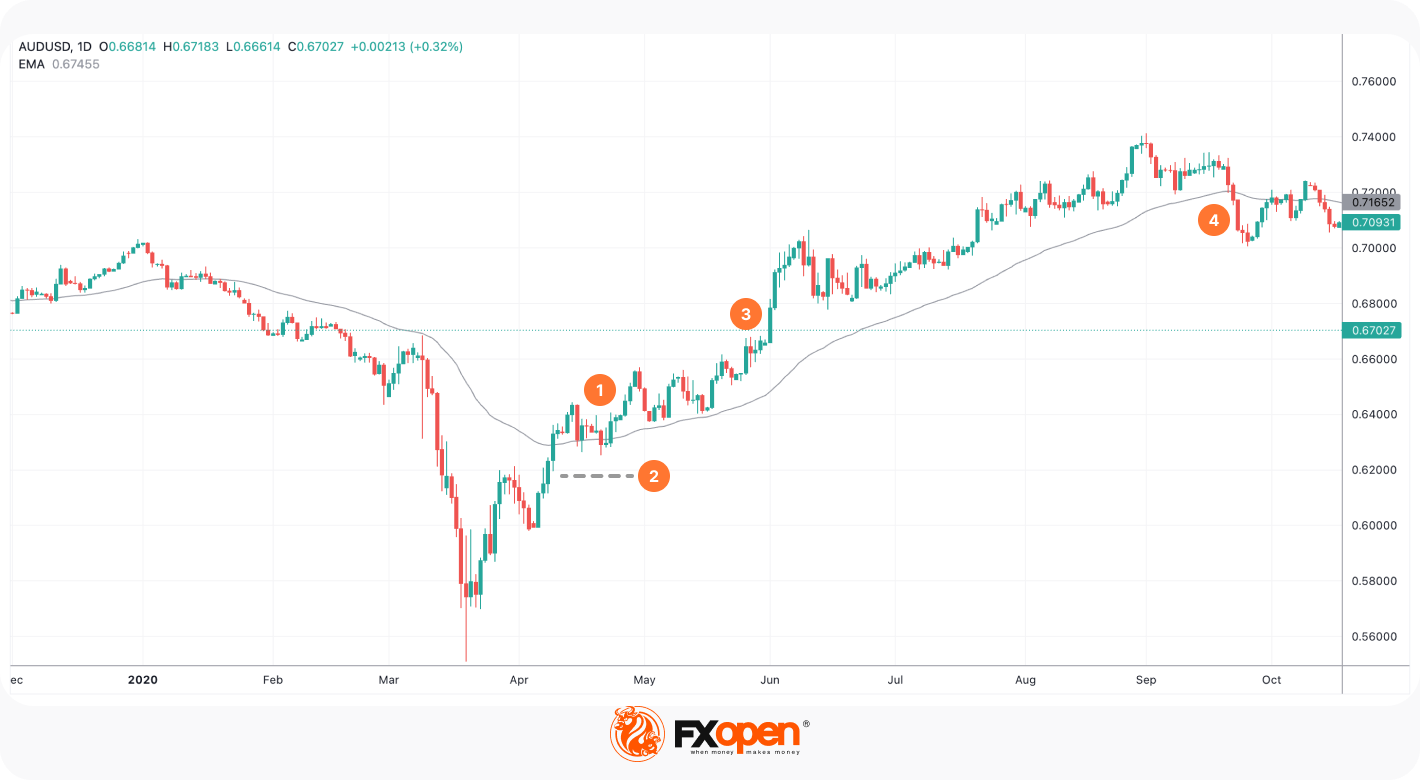
If you have been tracking an asset for a potential trade and want to use the EMA indicator to identify potential entry and exit points, look at the chart to see whether it is in an upward or downward trend.
If, for example, the asset is in an uptrend, you could wait for a pullback before opening a long position (1). If there is a crossover, it is a bullish signal to buy. You could set a stop-loss just below the recent low (2) and a profit target based on your risk-reward ratio or at the nearest highs (3). If the price continues to rise and the EMA also rises, the trend remains intact. You could hold the position open until the price crosses below the EMA, meaning that the trend has ended (4). You could then sell and take profit on the trade.
While the EMA is a popular tool among traders, it has certain limitations that should be considered when using it to make trading decisions:
Combining the EMA with other indicators might enhance trading strategies by providing more reliable insights. Since it is responsive to recent changes, using it alongside other tools may help confirm trends.
Traders often combine the EMA with the RSI to confirm trend direction and find optimal entry and exit points. For example, if the moving average indicates an upward trend and the RSI shows that an asset is oversold (RSI < 30), it may be a strong indication to buy. Conversely, if the line is trending down and the RSI indicates overbought conditions (RSI > 70), it may be a good time to sell.
By combining the EMA with horizontal support and resistance lines, traders can better anticipate price reversals. If an asset approaches a resistance level while trading below the line, it could strengthen the case for a potential downward reversal. Similarly, a price bouncing off a support level and crossing above the exponential moving average could demonstrate an upward trend.
An MACD uses two EMAs to measure momentum and project trend reversals. When combined with the EMA, MACD may confirm the strength of a trend. For example, if the MACD line crosses above the signal line while the asset is above the exponential moving average, it indicates a strong buy prompt. The reverse applies for sell signals when the MACD line crosses below the signal line with the price under the MA.
The exponential moving average is a tool that supports traders seeking to understand market trends and make timely decisions. By giving more weight to recent price movements, the EMA reacts faster to market changes than a simple moving average. This makes it one of the most popular tools for spotting short-term trends and potential entry or exit points.
If you want to apply the EMA to live charts, you may consider opening an FXOpen account and access over 700 assets with low commissions and tight spreads. Good luck!
The exponential moving average (EMA) may help traders identify trends and potential entry or exit points across different markets. Common ways to use the EMA include MA crossovers, which signal entries and exits; long-term EMAs, which highlight momentum shifts and trend strength; and combining short- and long-term EMAs to reveal trend changes and support/resistance levels. In short, the EMA adapts to any market by showing the direction of price and the strength of the trend.
The 50 EMA and 200 EMA are widely used long-term moving averages that are supposed to help traders assess broader market trends. The 50 EMA is calculated over 50 periods, making it more responsive to recent price changes, while the 200 EMA reflects longer-term movements. Traders often watch their crossovers to gauge market direction: when the 50 EMA crosses above the 200 EMA, it signals a bullish trend (golden cross), and when it crosses below, it indicates a bearish trend (death cross).
There isn’t a single EMA for scalping, but traders often rely on short-term exponential moving averages, such as the 9- or 12-period, to capture quick market movements. The indicator with these periods respond rapidly to price changes, making it one of the most popular tools for fast-paced strategies in volatile markets.
There is no single EMA timeframe. The timeframe depends on the trader's strategy. Short-term traders might use 9, 12, or 21 periods, while long-term investors typically apply 50 or 200 periods to assess broader trends.
*Important: At FXOpen UK, Cryptocurrency trading via CFDs is only available to our Professional clients. They are not available for trading by Retail clients. To find out more information about how this may affect you, please get in touch with our team.


