
Candlestick patterns are essential tools for identifying potential shifts in market sentiment. The inverted hammer is one of the most popular bullish reversal patterns that often appears after a downtrend, indicating a possible trend reversal. Correctly identifying this formation and interpreting its context may support traders in market analysis.
In this article, we will explore the meaning of inverted hammer candlestick and its characteristics, outline the criteria for recognising it on a price chart, and discuss practical ways used by traders when integrating it into trading strategies.
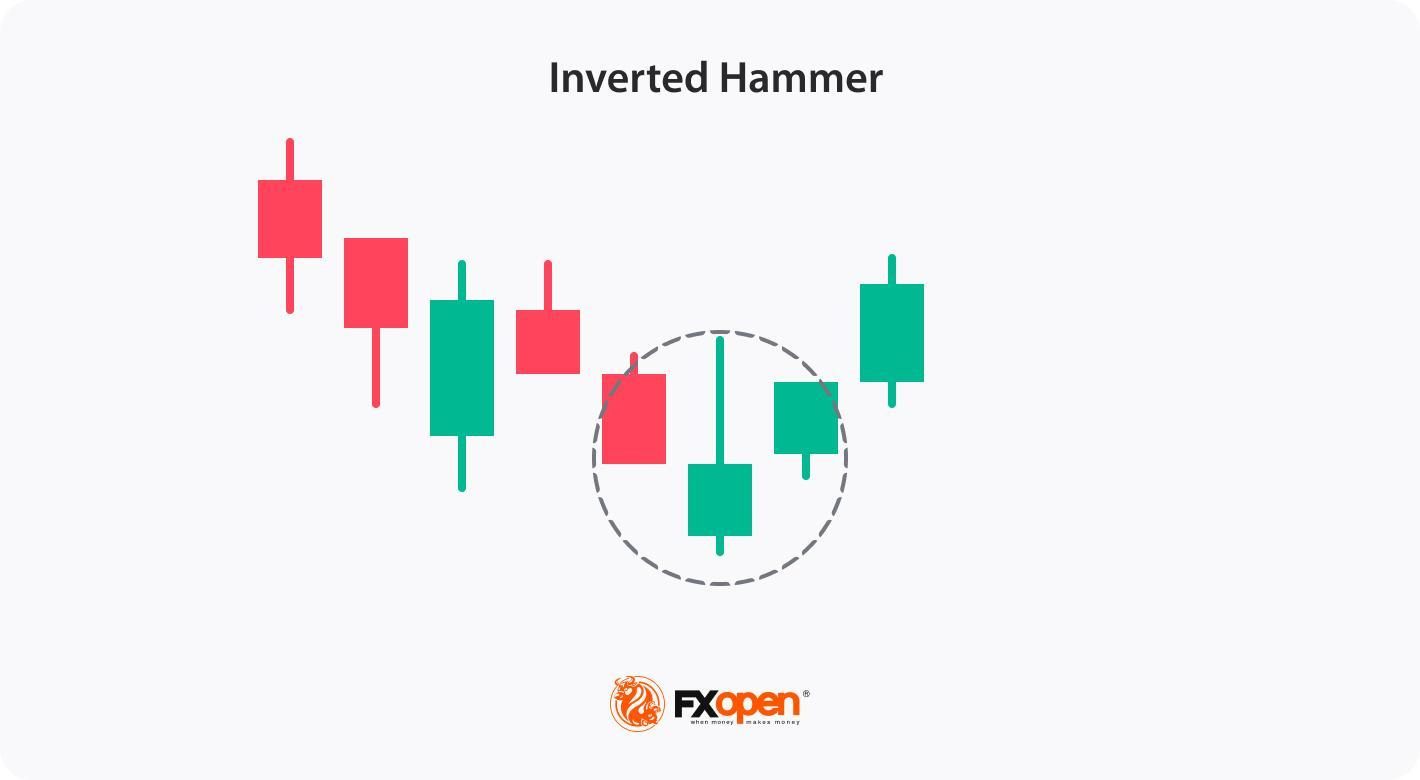
An inverted hammer is a candlestick pattern that appears at the end of a downtrend, typically signalling a potential bullish reversal. It has a distinct shape, with a small body at the lower end of the candle and a long upper wick that is at least twice the size of the body. This structure suggests that although sellers initially dominated, buyers stepped in, pushing prices higher before closing near the opening level. While the inverted hammer alone does not confirm a reversal, it’s often considered a sign of a possible trend change when followed by a bullish move on subsequent candles.
The pattern can have any colour so that you can find a red inverted hammer candlestick or upside down green hammer. Although both will signal a bullish reversal, an inverted green hammer candle is believed to provide a stronger signal, reflecting the strength of bulls.
One of the unique features of this pattern is that traders may apply it to various financial instruments, such as stocks, cryptocurrencies*, ETFs, indices, and forex, across different timeframes. To test strategies with an inverted hammer formation, you may consider using FXOpen’s TickTrader trading platform, which provides access to over 700 markets.
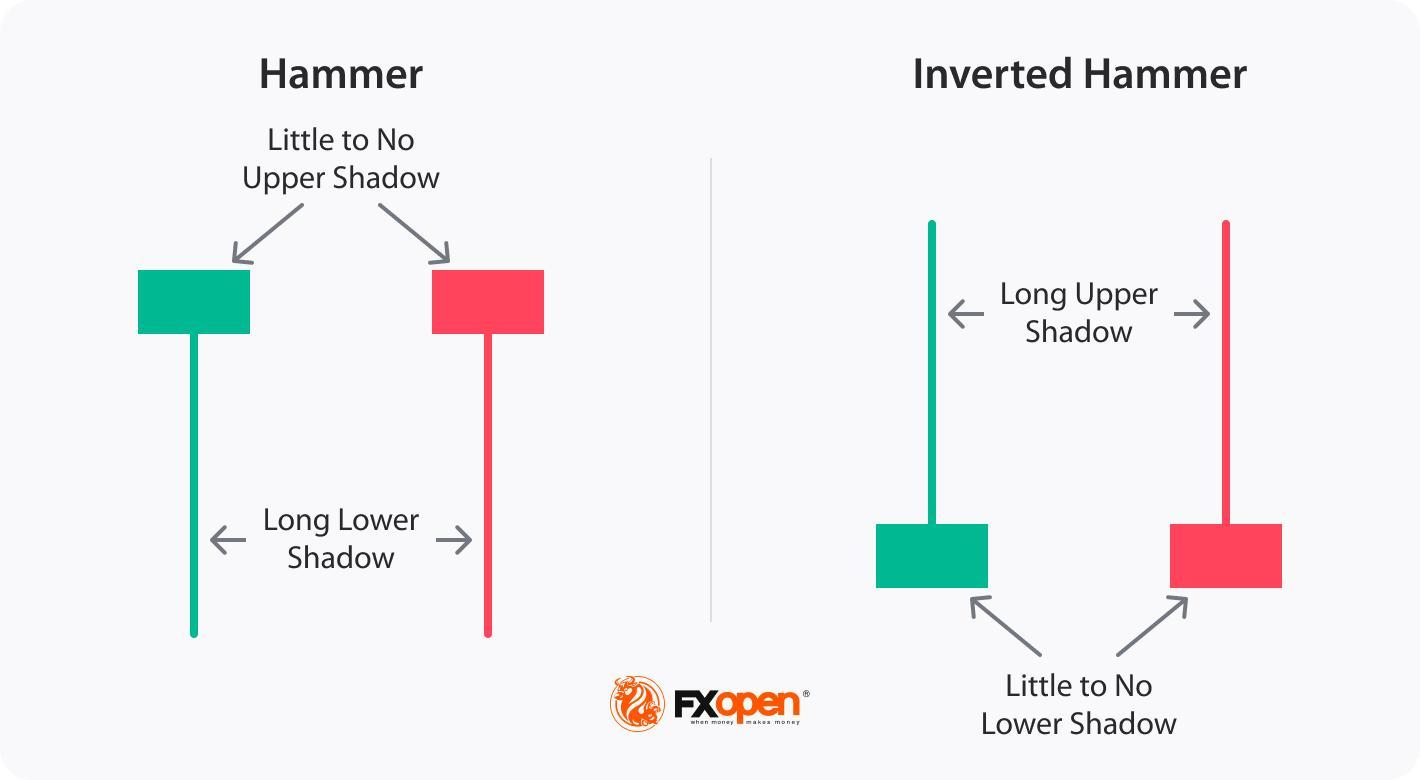
The hammer and inverted hammer are both single-candle patterns that appear in downtrends and signal potential bullish reversals, but they have distinct formations and implications:
Both patterns signal possible bullish sentiment, but while the green or red hammer candlestick focuses on buyer strength after selling, the inverted hammer suggests buyer interest in an overall bearish context, needing further confirmation for a trend shift.
Although the inverted hammer is easy to recognise, there are some rules traders follow to potentially strengthen the reversal signal it provides.
By following these steps and waiting for confirmation signals, traders might increase the reliability of the inverted hammer’s signals.
Trading the inverted hammer involves implementing a systematic approach to capitalise on potential bullish reversals. Here are some steps traders may consider when trading:
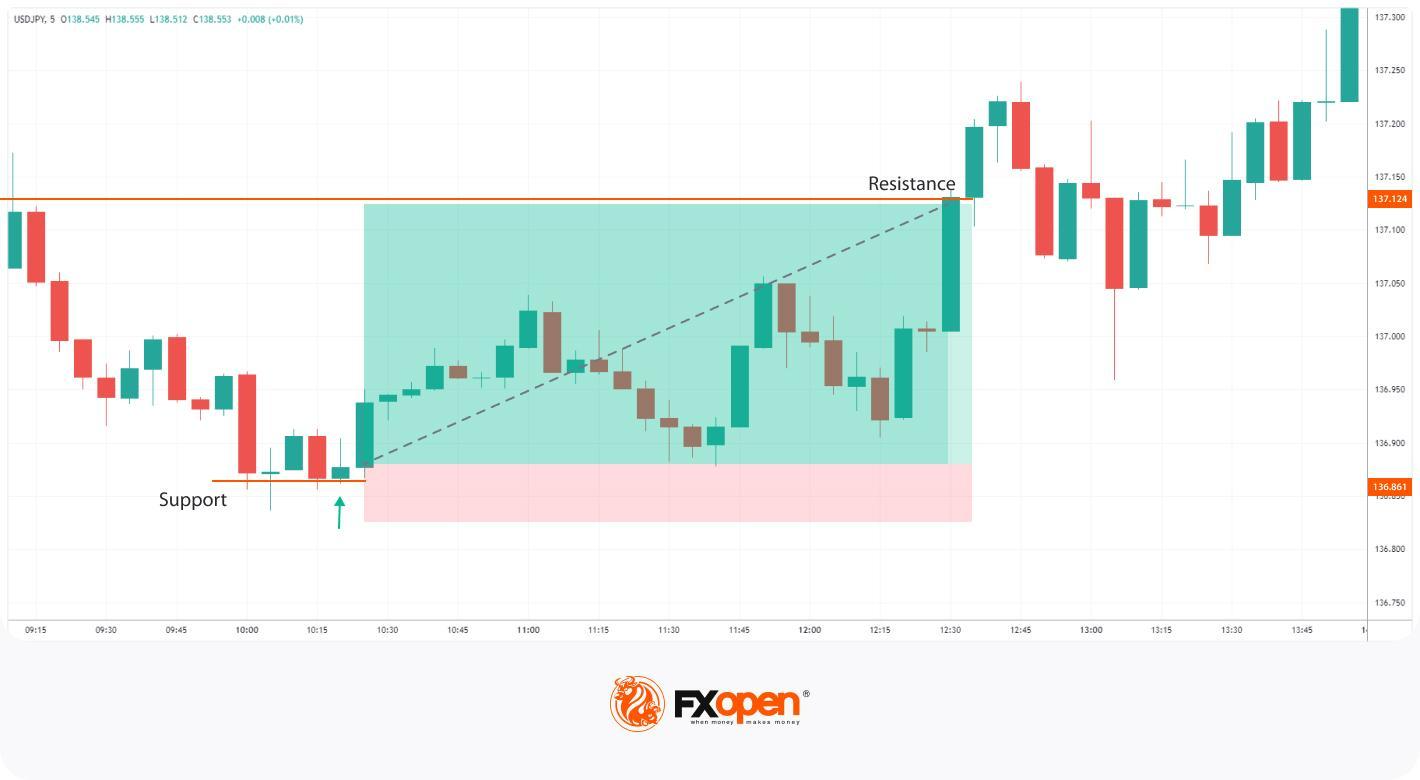
The trader looks for a bullish inverted hammer on the USDJPY chart. After a subsequent downtrend, the inverted hammer appearing at a support level signals a potential trend reversal. They enter the market at the close of the inverted hammer candle and place a stop loss below the support level. Their take-profit target is at the next resistance level.
A trader could implement a more conservative approach and wait for at least a few candles to form in the uptrend direction. However, as the pattern was formed at the 5-minute chart, a trader could enter the market too late or with a poor risk-reward ratio.
The inverted hammer has its strengths and limitations. Here’s a closer look:
Advantages
Limitations
While the inverted hammer can provide valuable insights into potential trend reversals, it should not be the sole basis for trading decisions. It is important to supplement analysis with other technical indicators and tools to strengthen the overall trading strategy. Also, risk management is crucial while trading this formation.
If you want to develop your own trading strategy, you may consider opening an FXOpen account and access over 700 markets with tight spreads from 0.0 pips and low commissions from $1.50.
Yes, it is considered a bullish reversal pattern. It indicates a potential shift from a downtrend to an uptrend in the market. While it may seem counterintuitive due to its name, the setup suggests that buying pressure has overcome selling pressure and that bulls are gaining strength.
When using an inverted hammer, traders wait for confirmation in the next session, such as a gap-up or strong bullish candle. They usually open a buy position with a stop-loss below the low of the pattern to potentially manage risk and a take-profit level at the closest resistance level.
It is generally considered a potential trend reversal signal. An inverted hammer in a downtrend suggests a shift in market sentiment from bearish to bullish. An inverted hammer in an uptrend does not signify anything.
After a reverse (or inverted) hammer candle, there may be a potential bullish reversal if confirmed by a strong bullish candle in the next session. However, without confirmation, the pattern alone does not guarantee a trend change.
In an uptrend, an inverted hammer isn’t generally considered significant because it’s primarily a reversal signal in a downtrend.
No, the inverted hammer and shooting star look similar but occur in opposite trends; the former appears in a downtrend as a bullish reversal signal, while the latter appears in an uptrend as a bearish reversal signal.
The hanging man and inverted hammer differ in both appearance and context. The former appears at the end of an uptrend as a bearish signal and has a small body and a long lower shadow, while the latter appears at the end of a downtrend as a bullish signal and has a small body and a long upper shadow.
A green (bullish) inverted hammer candlestick closes higher than its opening price, indicating a stronger bullish sentiment. A red (bearish) inverted hammer candlestick closes lower than its opening, which might indicate less buying strength, but both colours may signal a reversal if followed by confirmation.
*Important: At FXOpen UK, Cryptocurrency trading via CFDs is only available to our Professional clients. They are not available for trading by Retail clients. To find out more information about how this may affect you, please get in touch with our team.


