When most traders first come across the Fibonacci tool, it often feels like pure mathematics.
Numbers derived from a centuries-old mathematical sequence suddenly line up with price movements in the modern financial markets.
But then comes the question: is Fibonacci truly reliable on its own, or is it just another way of mapping support and resistance levels?
To answer this, it’s important to compare Fibonacci with two of the oldest and most trusted tools in trading: horizontal support and resistance and diagonal trendlines.
Jude Umeano, one of Nigeria’s most respected and successful traders just launched Afibie, a mentorship platform built to help you earn your first $10,000 and beyond from the markets.
Whether you’re new or stuck at break-even, this is your next step.👉 Visit Afibie now.
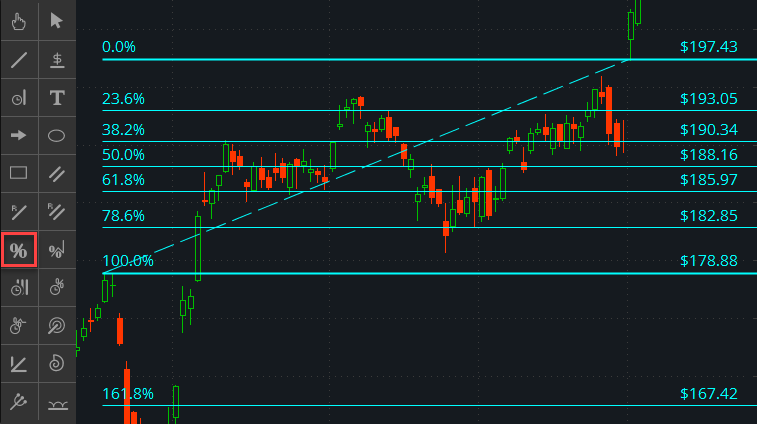
Fibonacci retracement and extension levels are created by dividing a price move into ratios such as 38.2%, 50%, and 61.8%.
Traders use these levels to identify areas where price might retrace after a strong move or extend when continuing a trend.
The main strength of Fibonacci is that it gives precise, predefined levels that can be plotted objectively on any chart.
You do not need to guess where the levels should be; the ratios are fixed, and once you mark the high and the low of a move, the levels appear automatically.
However, this strength is also its limitation. Because Fibonacci produces several levels, charts can quickly become crowded.
Traders often face the issue of multiple levels not all being respected, leaving uncertainty about which one is the “real” support or resistance.
For example, imagine a stock that rises from $100 to $150.
Applying Fibonacci retracement, the key levels would be $138.2, $125, and $119 (representing the 38.2%, 50%, and 61.8% retracements).
Traders watching this chart might expect the price to pull back to these levels before continuing upward. However, the stock might only touch $125 before resuming its trend, skipping the other levels entirely.
This illustrates both the usefulness and the limitation of Fibonacci: it provides structured guidance but must be used in conjunction with other tools and market context.
In other words, Fibonacci provides a mathematical projection, but it does not guarantee that the market will react to every level
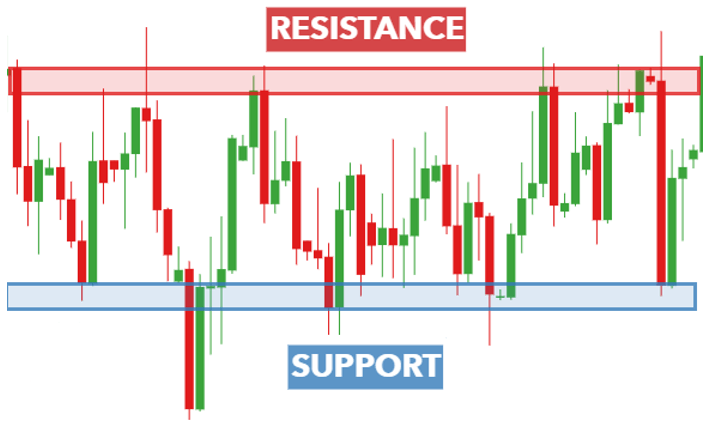
Support and resistance levels are some of the most straightforward tools in technical analysis.
Support is a price area where buyers have stepped in repeatedly, preventing price from falling further.
Resistance is where sellers have taken control, stopping price from rising. Unlike Fibonacci, these levels are not based on fixed ratios but rather on how the market has behaved in the past.
The advantage of support and resistance is that it reflects actual market memory. If price has reacted to a level several times before, there is a higher probability it will do so again.
Traders often prefer this because it feels more natural and less mechanical than Fibonacci.
The drawback, however, is subjectivity. Different traders may draw their levels slightly differently, and the significance of a level can sometimes depend on how much weight you personally assign to it.
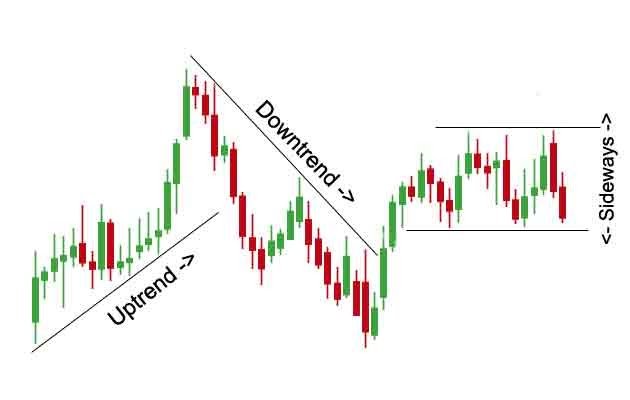
Trendlines are another classic tool, drawn diagonally to connect higher lows in an uptrend or lower highs in a downtrend.
They act as dynamic support or resistance, showing traders both the direction of the trend and possible bounce zones along the way.
The strength of trendlines lies in their ability to visualize momentum and market structure. They make it clear when a market is accelerating, slowing down, or reversing.
But trendlines are also prone to false breakouts. A market may pierce a trendline temporarily before continuing in its original direction, which can trap traders who rely on it alone.
Like support and resistance, trendlines require judgment and interpretation in their placement.
The biggest difference between Fibonacci and the other two tools is that Fibonacci is predictive, while support, resistance, and trendlines are reactive.
Fibonacci tries to project where price might turn based on a mathematical ratio, while support and resistance simply highlight where price has already turned in the past.
Trendlines extend this idea into the future by projecting the slope of the trend.
This is why many traders don’t view Fibonacci as a standalone tool but rather as a complement.
For example, if a Fibonacci retracement level aligns with a well-tested support zone or a rising trendline, the probability of price reacting at that point increases significantly.
This overlap is known as confluence, and it is often where traders find their best opportunities.
Every tool shines under certain conditions. Fibonacci retracements work best when the market has made a strong move and you want to anticipate how deep the pullback might be.
Fibonacci extensions are useful for projecting profit targets when price is breaking into new territory.
Support and resistance remain reliable anchors for almost every style of trading, whether range-bound or trending, because they represent actual turning points in market psychology.
Trendlines are most effective when you are riding a trend and want to identify dynamic zones of support or resistance.
Instead of choosing one tool over the other, the real power comes from combining them.
If a Fibonacci level lines up with a horizontal support level and price is also respecting an upward trendline at that point, the case for a potential reversal becomes much stronger than if you relied on any single tool.
The debate between Fibonacci and tools like support, resistance, and trendlines isn’t really about which one is better.
Each has its role. Fibonacci gives you mathematical precision, support and resistance show where traders have reacted before, and trendlines reveal the slope of the market’s momentum.
When you use them together, you get a fuller picture of price action.
No tool works perfectly on its own, but combining them increases your accuracy and confidence.
So next time you draw Fibonacci levels, don’t stop there. Check if they line up with support, resistance, or trendlines. The more they agree, the stronger the setup.
What about you, do you rely more on Fibonacci or traditional tools? Drop your thoughts in the comments, and if you found this helpful, share it with another trader who might benefit.
The post Fibonacci Levels vs Trendlines and Other Trading Tools appeared first on NIGERIA BITCOIN COMMUNITY.