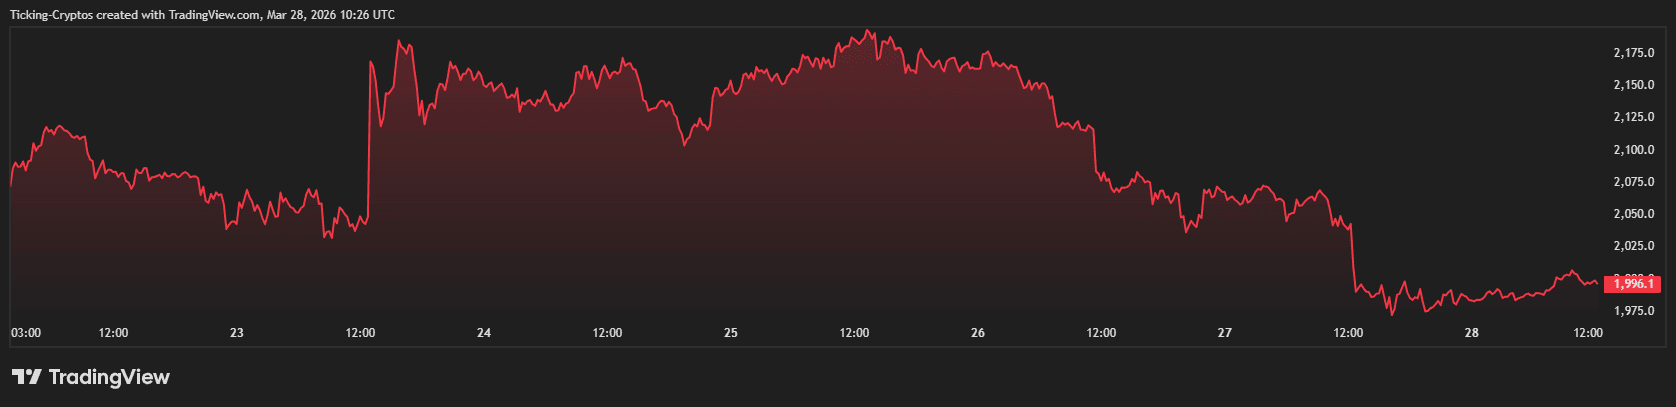
The current decline in Ethereum’s value is not an isolated event but a combination of technical breakdowns and fundamental shifts. After failing to sustain momentum above $2,200 earlier this month, ETH faced a series of "sell-the-news" events, including the aftermath of the FOMC rate decision and persistent outflows from spot Ethereum ETFs.
The most alarming signal for traders is the clear break in the ascending trendline that has supported ETH since its February lows. Looking at the current charts, Ethereum was carving out a recovery path until it hit a wall at the $2,300 resistance zone.
As seen in the technical structure, the price has now closed below the 50-day Simple Moving Average (SMA). This level acted as a dynamic floor for several weeks; its loss often precedes a "flush out" to the next major liquidity zones.
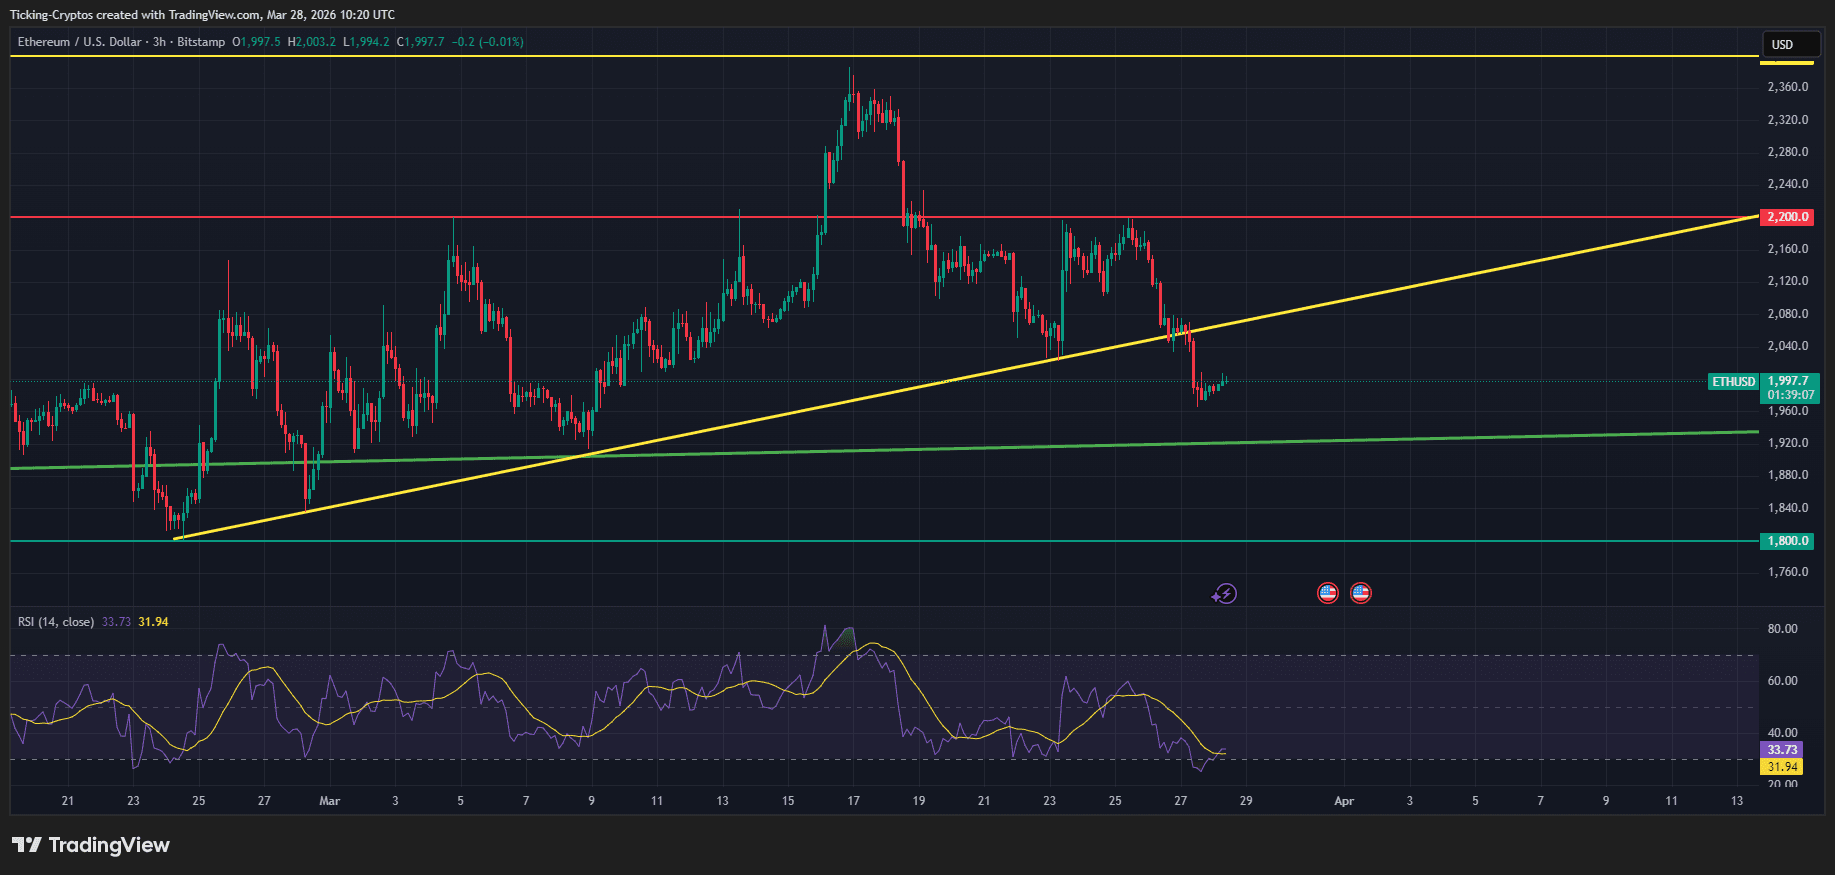
With the $2,000 support now acting as resistance, analysts are looking at the following levels:
Despite the launch of several staked ETH products earlier this year, institutional demand has remained surprisingly thin. According to Farside Investors, net outflows from spot Ethereum ETFs have accelerated this week. This suggests that while "Smart Money" is accumulating at lower levels, the immediate sell pressure from retail and legacy holders is overwhelming the current buy-side liquidity.
The break below $2,000 is a significant blow to the short-term bullish thesis. While Ethereum remains the backbone of decentralized finance (DeFi), the price action is currently dominated by bearish momentum and trendline invalidation. Traders should watch for a daily close back above $2,050 to signal a "fakeout"; otherwise, the path of least resistance remains downward.


