
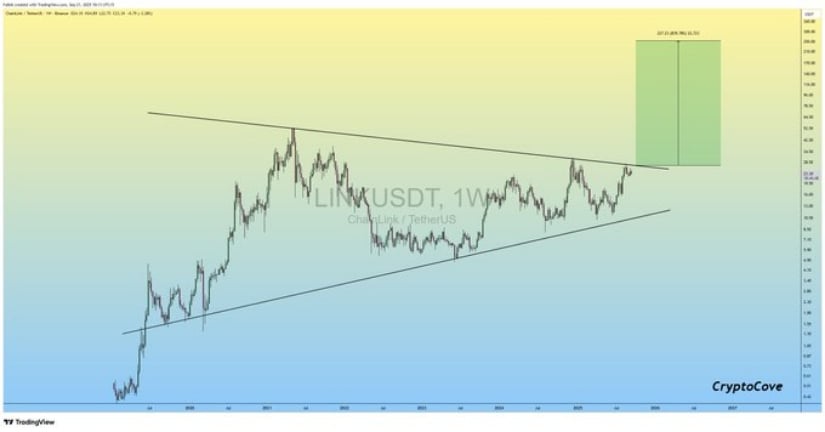
With higher lows forming against a line of lower highs, price action is now nearing the apex of this structure, fueling anticipation of a decisive move. At $23.35, the asset sits close to upper resistance, where a breakout could reshape the next phase of its long-term trajectory.
According to analyst Captain Faibik on X, the measured move of this multi-year triangle projects a target zone between $35 and $40, echoing historical rallies that began with similar setups. The analyst points to strengthening indicators, RSI rebounding from the midline, and MACD momentum trending upward as signs of growing bullish energy.
With volume supporting accumulation, Faibik underscores the value of positioning early before confirmation, highlighting the potential for significant upside once resistance is cleared.
Source: X
This symmetrical triangle pattern reflects years of both accumulation and distribution phases, suggesting the market is preparing for a decisive trend. Faibik’s bullish outlook builds on historical precedent, where similar technical setups in this asset have preceded powerful expansions. If momentum continues to climb, the probability of a sustained breakout strengthens considerably.
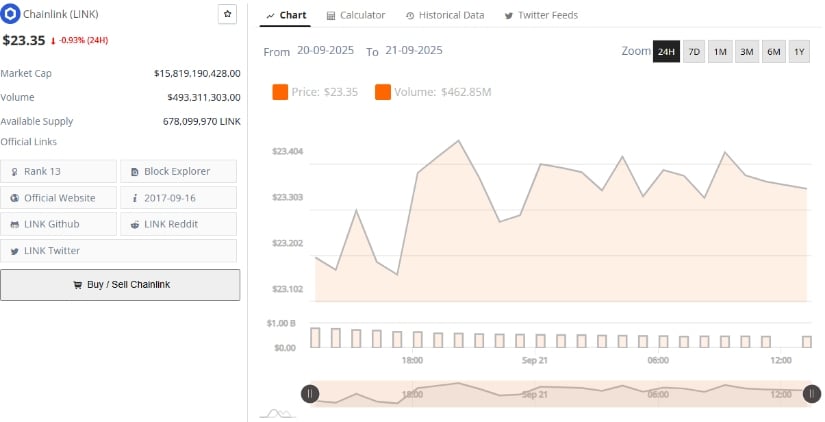
Fresh data from BraveNewCoin highlights a strong fundamental backdrop. Chainlink currently trades at $23.35 with a market cap of approximately $15.8 billion and a 24-hour trading volume of nearly $493 million. Despite a minor 0.93% dip in the last day, liquidity remains robust, ensuring healthy participation across exchanges.
Source: BraveNewCoin
Short-term forecasts project stability through September 2025, with price ranges expected between $23.10 and $23.57 and an average close to $23.20. Analysts anticipate continued momentum into October and November, with gradual advances toward the $24–$25 region. By December, expectations place the average price near $26, supported by growing institutional interest and an improving market outlook.
These figures reinforce the view that the asset is not only consolidating but also preparing for its next expansion phase. With solid fundamentals in place, the token remains well-positioned for renewed momentum once technical confirmation aligns with demand.
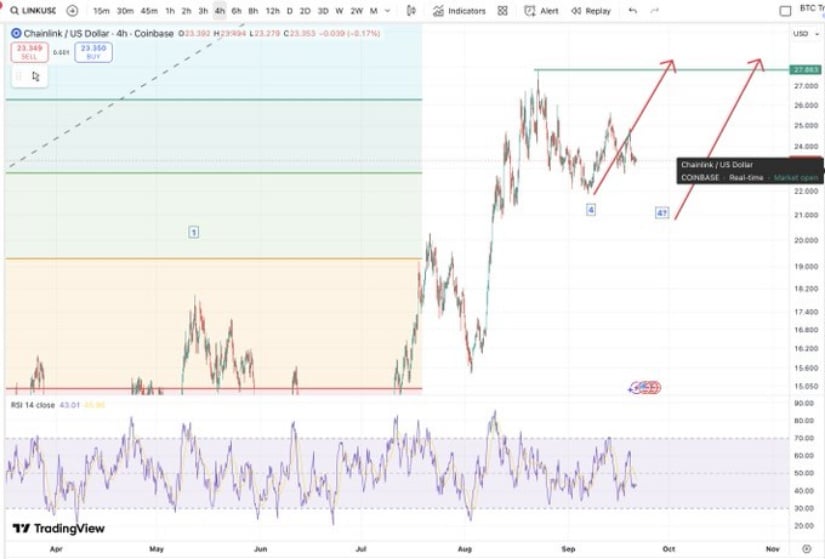
Further analysis from veteran trader Matthew Dixon points to a nearing resolution of the consolidation phase. His Elliott Wave outlook suggests the corrective wave 4 structure may be complete, or require only a minor dip before transitioning into wave 5. Support has formed around $22–$23, while resistance at $27.88 is identified as the breakout trigger that could ignite substantial bullish momentum for link.
Source: X
The RSI on the 4-hour chart holds steady in neutral territory, confirming balanced conditions without signs of exhaustion. Higher lows continue to form, reinforcing accumulation trends, while the breakout above $27.88 remains the key signal for an impulsive rally. Dixon highlights this level as critical for unlocking upside potential toward $28 and beyond, positioning the market for its next significant move.


