
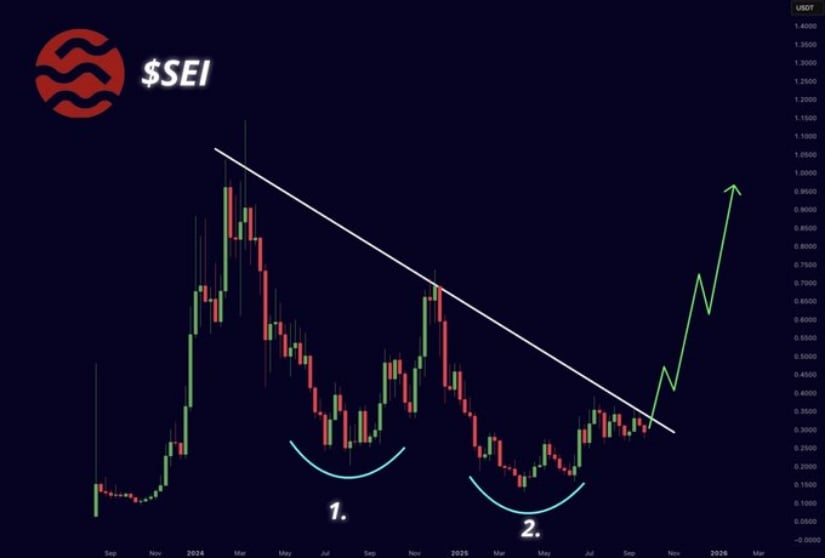
With the coin consolidating near $0.28, the market appears to be preparing for a pivotal test of the descending trendline that has capped rallies since late 2023.
According to chart observations shared by GigaEmmanuel Sei and echoed by other market watchers, the asset has completed two distinct troughs marked by rounded bottoms. This formation, combined with repeated trendline challenges, reflects a textbook double-bottom reversal setup.
Source: X
Analysts emphasize that if buyers manage to push decisively through the descending resistance, a swift rally could unfold as sellers are squeezed out of their positions.
The projected green path in the shared chart outlines potential upside toward the $0.80–$1.00 region, levels not seen since early this year. Traders point out that sentiment is shifting, as technical maturity and community attention converge at this critical moment. With momentum building, the stage is being set for a possible breakout in the weeks ahead.
Fresh figures from BraveNewCoin show Sei trading at $0.28 with a market capitalization of $1.73 billion, ranking 86th among digital assets. Daily trading volume stands at $106 million, underscoring strong liquidity even as price action retreats 3.58% over the past 24 hours. At the time of writing, the token exchanged hands at $0.2829, down 2.95% on the day.
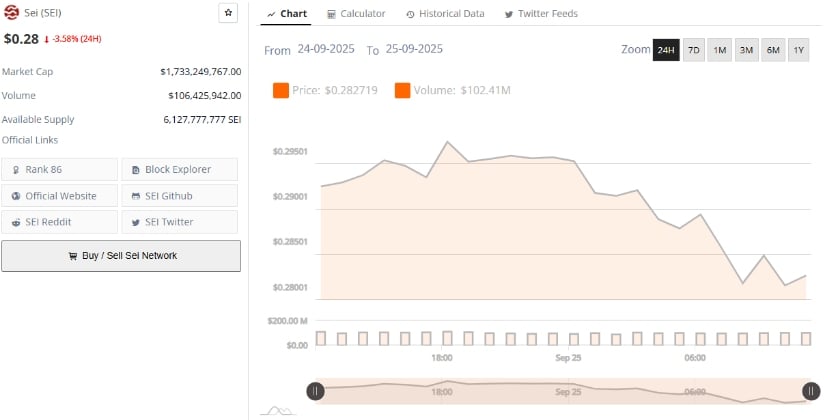
Source: BraveNewCoin
The circulating supply remains steady at 6.12 billion tokens, ensuring accessibility across global exchanges. Current trading ranges mirror levels last visited in early July, reinforcing the idea of consolidation within a broad support zone.
While recent attempts to reclaim $0.39 have failed, the asset’s market depth and participation provide a cushion for accumulation at present levels. These conditions offer a balanced foundation for a potential rebound if buyers regain momentum.
Short-term indicators highlight the ongoing struggle between bulls and bears. The MACD line sits below both the signal line and the zero axis (MACD: -0.0037, Signal: 0.0015, Histogram: -0.0052), reflecting weak bullish momentum and confirming that sellers still hold the upper hand. Negative histogram values across recent sessions further underline the cautious mood in the market.
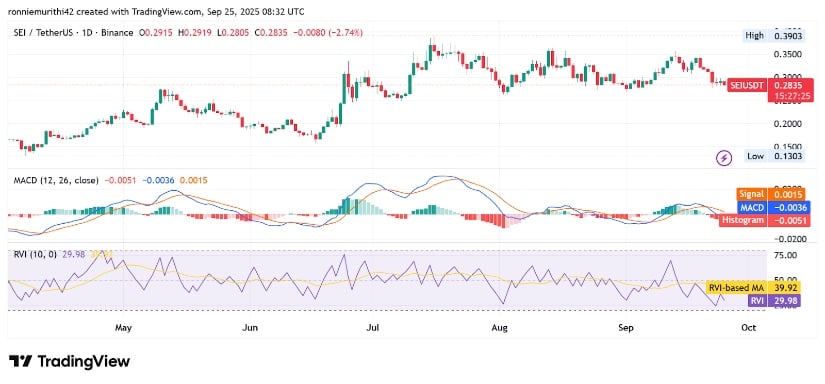
Source: TradingView
The Relative Vigor Index (RVI) at 29.96, compared with its moving average of 39.92, adds weight to the bearish view, showing a lack of conviction from buyers.
Still, analysts on X argue that this compression phase is necessary before a reversal, with the double-bottom acting as a possible launchpad once conditions shift. If momentum flips, a decisive breakout above the trendline could ignite the strong upward move projected in the charts.


