
With the token trading around $0.38, recent chart patterns and long-term technical formations suggest that the asset could be gearing up for a substantial breakout toward $0.50, provided bulls successfully defend key price zones.
In a recent X post, Ali pointed Stellar’s $0.37 price zone has become a pivotal line in the sand, serving both psychological and technical importance. The chart shows that the coin has recently broken above a long-standing descending resistance line, transforming a previously bearish setup into one that now favors continuation to the upside.

Source: X
Ali notes that the 0.786 Fibonacci retracement level intersects precisely at $0.37, amplifying its strength as a support and accumulation area. Holding this level could spark a swift advance toward sequential resistance targets at $0.42, $0.45, and $0.50, which align with Fibonacci extensions derived from previous swing highs.
However, a decisive breakdown below $0.37 could trigger a short-term correction toward $0.34–$0.35, where secondary demand zones have historically absorbed selling pressure. The analyst underscores that this period of tight-range consolidation represents a “make or break” scenario, with upcoming volume spikes likely determining the next directional bias.
On one hand, according to BraveNewCoin data, Stellar is currently priced at $0.38, marking a 2.38% gain over the last 24 hours. The asset’s market capitalization stands at $12.29 billion, supported by a 24-hour trading volume of $231 million and a circulating supply of 32.0 billion tokens. This positioning places the crypto comfortably within the top 20 digital assets by market cap.

Source: BraveNewCoin
Market activity data shows that the asset continues to trade steadily above its 50-day exponential moving average (EMA), suggesting ongoing strength in its medium-term trend. Despite moderate intraday fluctuations, liquidity and volume patterns remain consistent, a hallmark of accumulation-driven markets rather than speculative exhaustion.
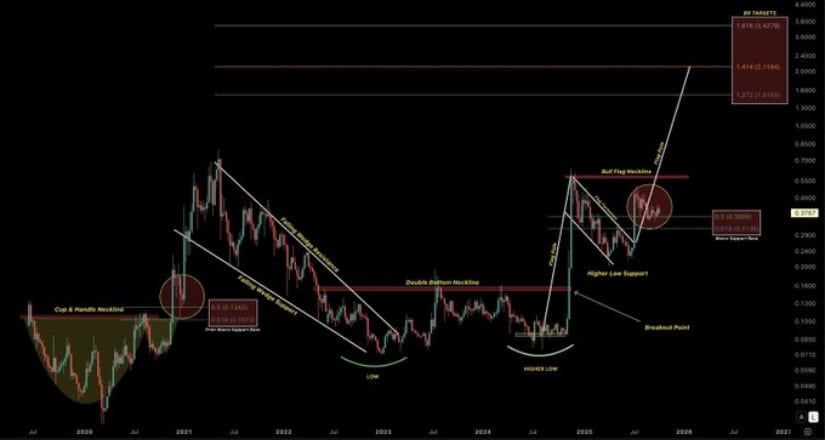
On the other hand, in a separate analysis shared by ChartNerd, Stellar’s broader technical framework reveals multiple bullish long-term formations, including a cup-and-handle, double bottom, and, most recently, a bull flag structure. The analyst suggests that before entering price discovery, the coin could retrace toward $0.31, a historical support zone that has previously acted as a springboard for major rallies.
Source: X
ChartNerd’s projections identify the $1.00 region as the first major upside milestone following confirmation of the bull flag breakout. Beyond that, $3.00 is cited as a highly realistic target within the next bullish cycle, while $8.00 represents a maximal, euphoric-level stretch projection achievable only under ideal market conditions and extended macro bull momentum.


