
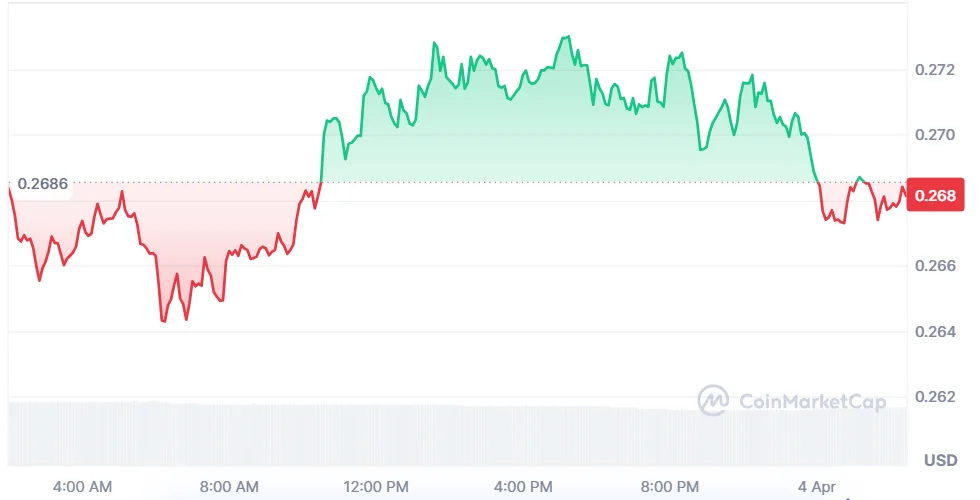
Worldcoin (WLD) price is stabilizing near a key support zone after a prolonged decline from its all-time high, as of April 4, 2026. Price action remains tight, showing compression as traders wait for confirmation of the next directional move.
As of press time, WLD price is trading at $0.2682, showing a 0.49% uptick in a day. The trading volume is down by 9.31% and is currently standing at $111.11 million. Over the past seven days, the WLD price has increased by 3.82%, according to CoinMarketCap.
The WLD price outlook shows that the asset is still trading within a macro descending channel. The token has dropped nearly 98% from its peak of $11.97. This places the price in a high-timeframe discount zone.
Also Read: Worldcoin (WLD)’s Reclaim Above $0.66 Could Trigger Macro Rally Above $10
Analyst Crypto Patel highlighted that the WLD is consolidating around a key support area. It could act as an accumulation area.
However, there is no confirmation of a bullish breakout of the pattern. Breaking the horizontal line of $0.66 could confirm a trend reversal.
The WLD price forecast still hinges on the ability to return to higher resistance zones. According to analysts, there are upside targets at $0.66, $2, $5, and $10+. However, these levels can only be reached if WLD is able to demonstrate strength above these levels.
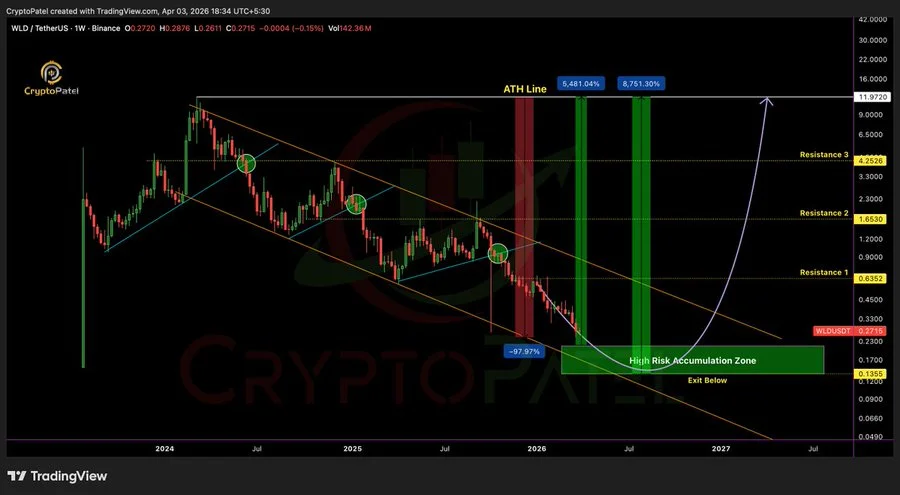
On the downside, risk remains if support fails. A weekly close below $0.13 would invalidate the current setup. This level is seen as critical for maintaining any bullish expectations.
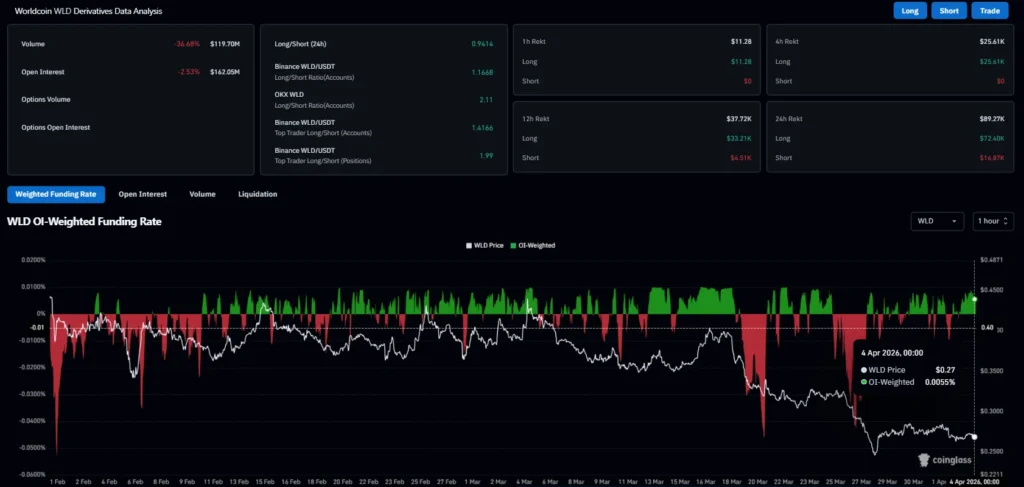
According to CoinGlass data, the future volume decreased by 36.68% to $119.70 million. Open interest has fallen by 2.53% to $162.05 million. The OI-weighted funding rate is at 0.0055%. This suggests a slight bullish bias among leveraged traders.
The Relative Strength Index (RSI) is at 34.11, while its moving average stands at 34.69. Both figures continue to stay below the neutral 50 mark. This means that there is little momentum and buying power. There is an improvement in RSI from the previous low, although it is not indicative of any reversal trend.
The Moving Average Convergence Divergence (MACD) indicator remains in negative territory. The MACD line stands at -0.0282 and the signal line at -0.0267. The histogram level is -0.0015. These figures confirm bearish trend continuation.
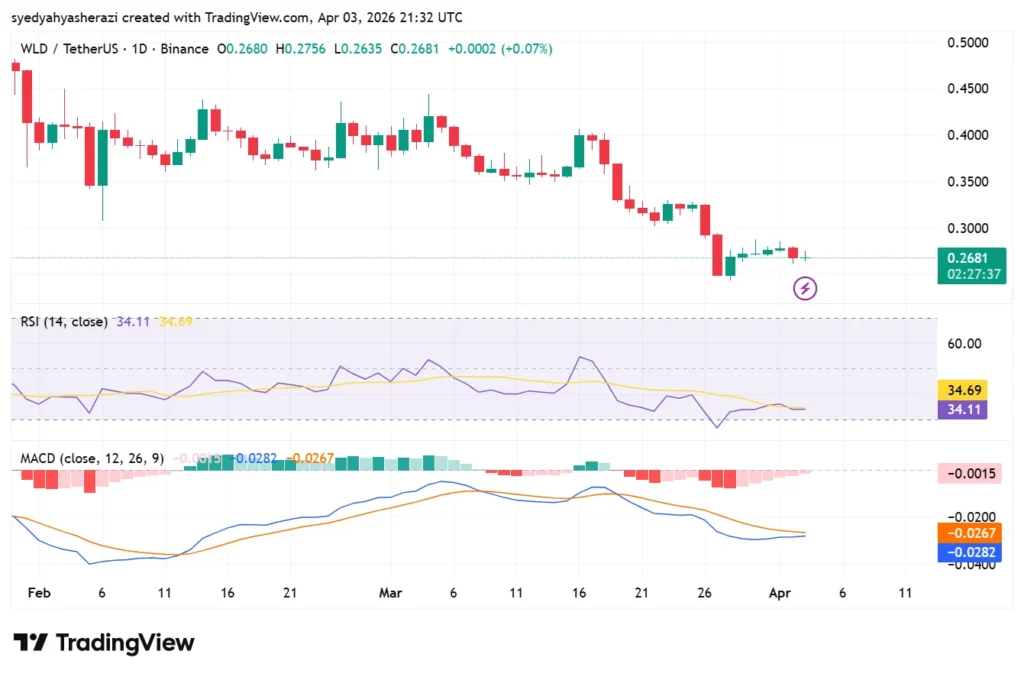
However, the narrowing histogram can point to a slowdown of the downward momentum. No bullish divergence has occurred on the indicator yet.
Additionally, the WLD price prediction depends on the formation of a bullish breakout. In case of breaking above the resistance level of $0.66, higher prices can be expected. Without this, consolidation may continue.
Downside risk remains if support levels weaken. Traders are closely watching key levels for direction. The market remains in a wait-and-see phase.
This article contains market analysis and price predictions. These are not guarantees. Crypto markets are volatile. Always DYOR. Not financial advice.
Also Read: Ethereum (ETH) Gains Strength: Could Foundation’s $93M Stake Trigger $50K Rally?

