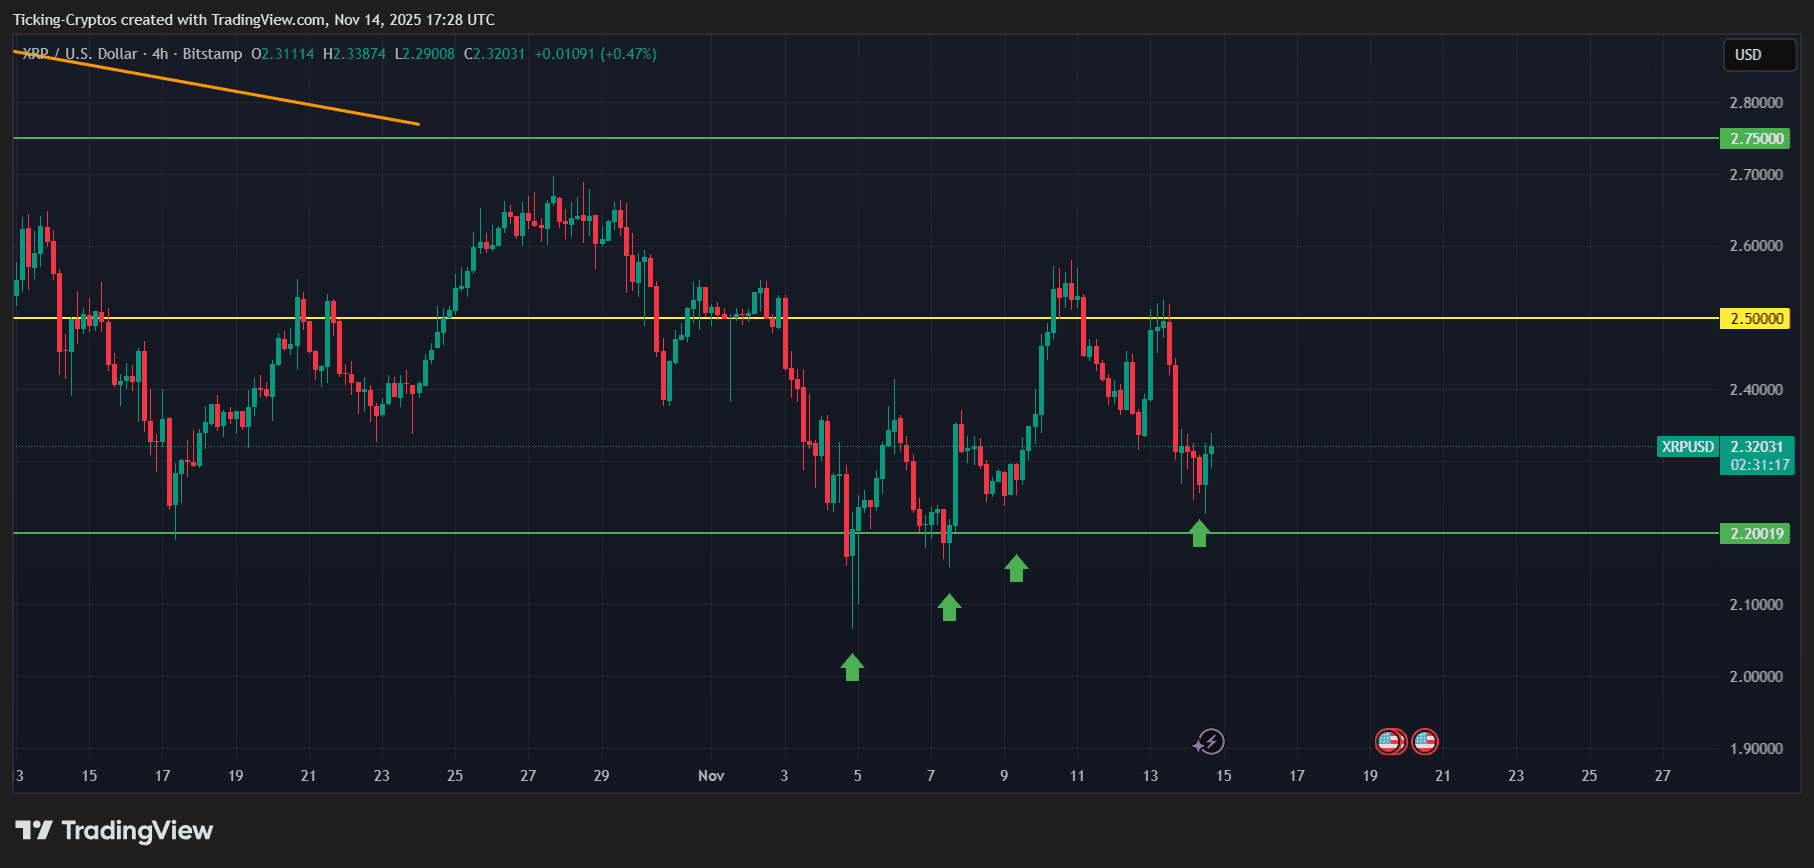
XRP/USD 4-hour chart - TradingView
This forms a range between $2.20 and $2.50, with higher volatility expected as Bitcoin continues to influence market direction.
Even during positive market moments, XRP tends to move late compared to other altcoins — a well-known characteristic.
But when Bitcoin crashes, XRP often follows with amplified delay.
Currently:
XRP’s resilience at $2.20 is notable — but historically, when Bitcoin makes a violent move, XRP eventually reacts.
That means the real question becomes:
👉 What happens if Bitcoin continues falling toward $90K?
If Bitcoin drops to $90,000, the probability of XRP losing its support increases sharply.
If $2.20 breaks:
The market has shown multiple fakeouts below $2.20, but the structure suggests weakening demand — especially if external pressure (Bitcoin) intensifies.
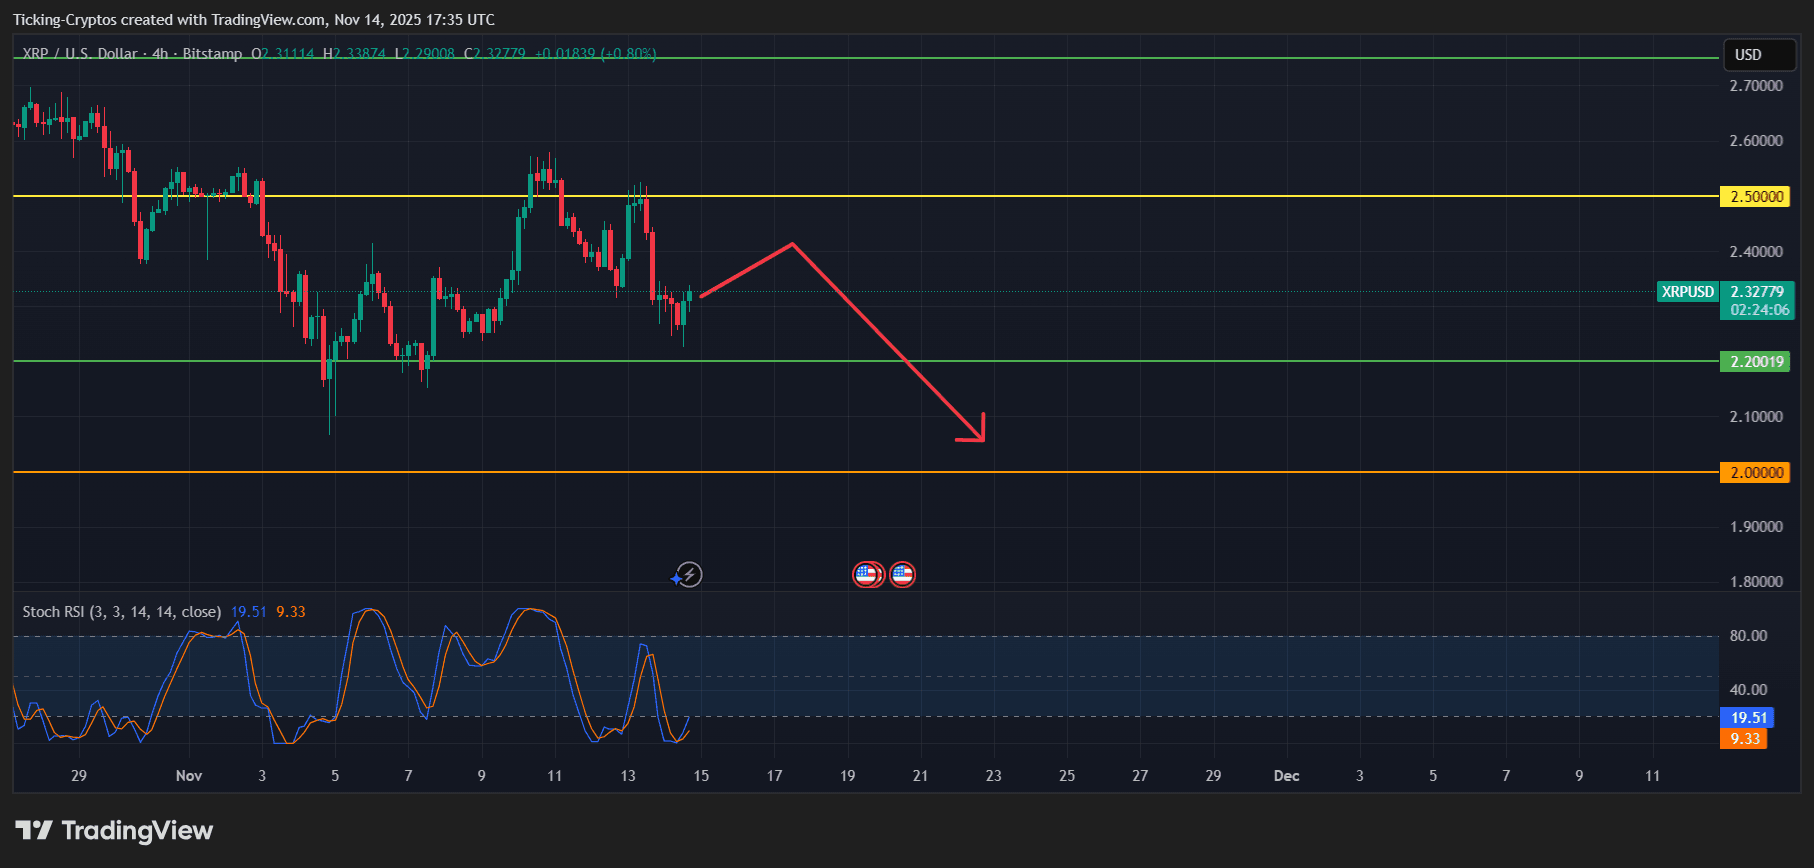
XRP/USD 4-hour chart - TradingView
A successful rebound (as we see on the chart) can lead to:
However, as long as Bitcoin remains unstable, XRP’s upside stays limited.
| Scenario | XRP Target |
|---|---|
| Bullish Bounce | $2.35 → $2.50 |
| Neutral Range | $2.20 → $2.35 |
| Bearish Breakdown | $2.05 → $2.00 (if BTC hits 90K) |
Given current chart signals, the $2.20 support remains the critical line for determining the next move.

