XRP is down 8.48 percent over the past seven days, trading around $1.3672 after a daily candle that opened at $1.3793, tapped $1.3963 and closed 0.91 percent lower. On a screener full of red numbers that looks like just another altcoin bleeding out.
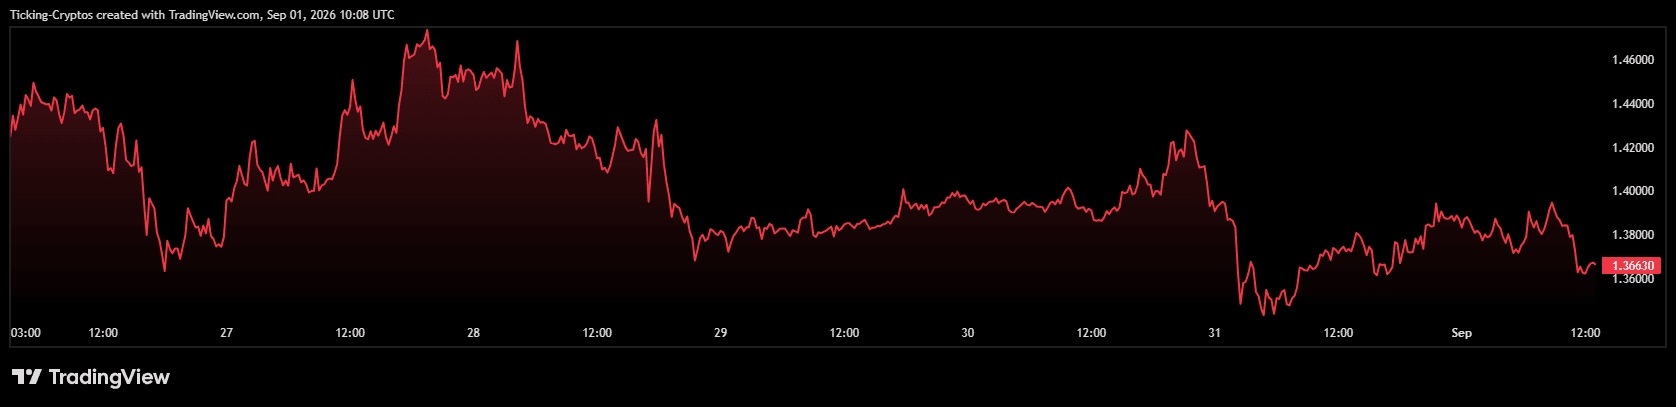
It is not. $XRP was the single best performing large cap in crypto ten days ago. It went from roughly $1.00 to an intraday high of $1.6963 in five sessions, its strongest week in 21 months, and finished August up around 28.5 percent, its best August since 2021.
So the honest framing of this week is not "XRP crashed". It is "XRP gave back part of a violent, leveraged, macro-driven spike". Those are very different setups for anyone thinking about buying, and the difference is the whole article.
Because the thing that pushed it up was never really about XRP.
On August 19 the US Treasury announced it would expand its buybacks of long-dated government debt, raising the cap on individual operations from $2 billion to at least $4 billion for 10 to 30 year maturities, running from September 9 through November 4. Long-term yields fell hard. The 30-year had been sitting at a 19-year high above 5.33 percent and dropped toward 5.19 percent.
Traders immediately relabelled this as "QE Lite" or curve control, and risk assets ripped. XRP ripped hardest, up around 51 percent while Bitcoin managed 22 percent, Ethereum 30 percent and Solana 28 percent over the same stretch.
Two things are worth being precise about here, because a lot of coverage was not.
First, this was not yield curve control. The Treasury described the operations as liquidity support for parts of the bond market receiving heavy volumes of eligible offers. Actual curve control means a central bank setting a yield ceiling and buying unlimited quantities to defend it. Scheduled, capped operations by the Treasury are not that. The YCC read was a market interpretation, not announced policy.
Second, a large chunk of the move was shorts getting run over. CoinGlass data circulated showing roughly $2 billion in shorts liquidated during the week, but that figure covered the entire crypto market rather than XRP alone, and about $1.2 billion of it came in a single 24 hour window. The available data does not support the claim of nearly $2 billion in XRP-specific short liquidations that got repeated widely.
Strip it down and the August spike was a macro liquidity headline, amplified by a short squeeze, on an asset that had underperformed so badly it was crowded with bearish positioning. Whale accumulation of around 380 million tokens in one week and a White House crypto summit added fuel. None of that is nothing. But none of it is a durable, XRP-specific demand story either.
When the squeeze fuel ran out, the price came back down. That is this week.
This is the strongest part of the bull case, and it is genuinely strong.
US spot XRP ETFs pulled in $110.49 million in the week ending August 28, their best weekly haul of 2026 by a wide margin. Cumulative net inflows across the products have reached $1.66 billion, with total net assets around $1.44 billion.
The timing detail matters more than the headline. Of the roughly $153.55 million that flowed in during all of August, only about $3.27 million arrived between August 3 and 14. The remaining $150 million or so landed in the final two weeks, and the buying has continued through nine consecutive positive sessions.
So ETF demand did not lead this rally. It chased it. That is a meaningful distinction: chasing flows tend to be more sensitive to price than anticipatory ones, and they can reverse quickly if the tape turns. The seven US spot XRP funds together hold around 977.92 million XRP, which is real structural demand, but it is a fraction of what circulates.
The daily chart is unusually informative right now, because the spike left a very specific footprint.
XRP is sitting at $1.3672, directly on top of the 200-day EMA at $1.3508. That moving average had been falling all year and capped every rally attempt since spring. The August surge blew straight through it, and the current pullback is the retest. That is the single most important thing on this chart.
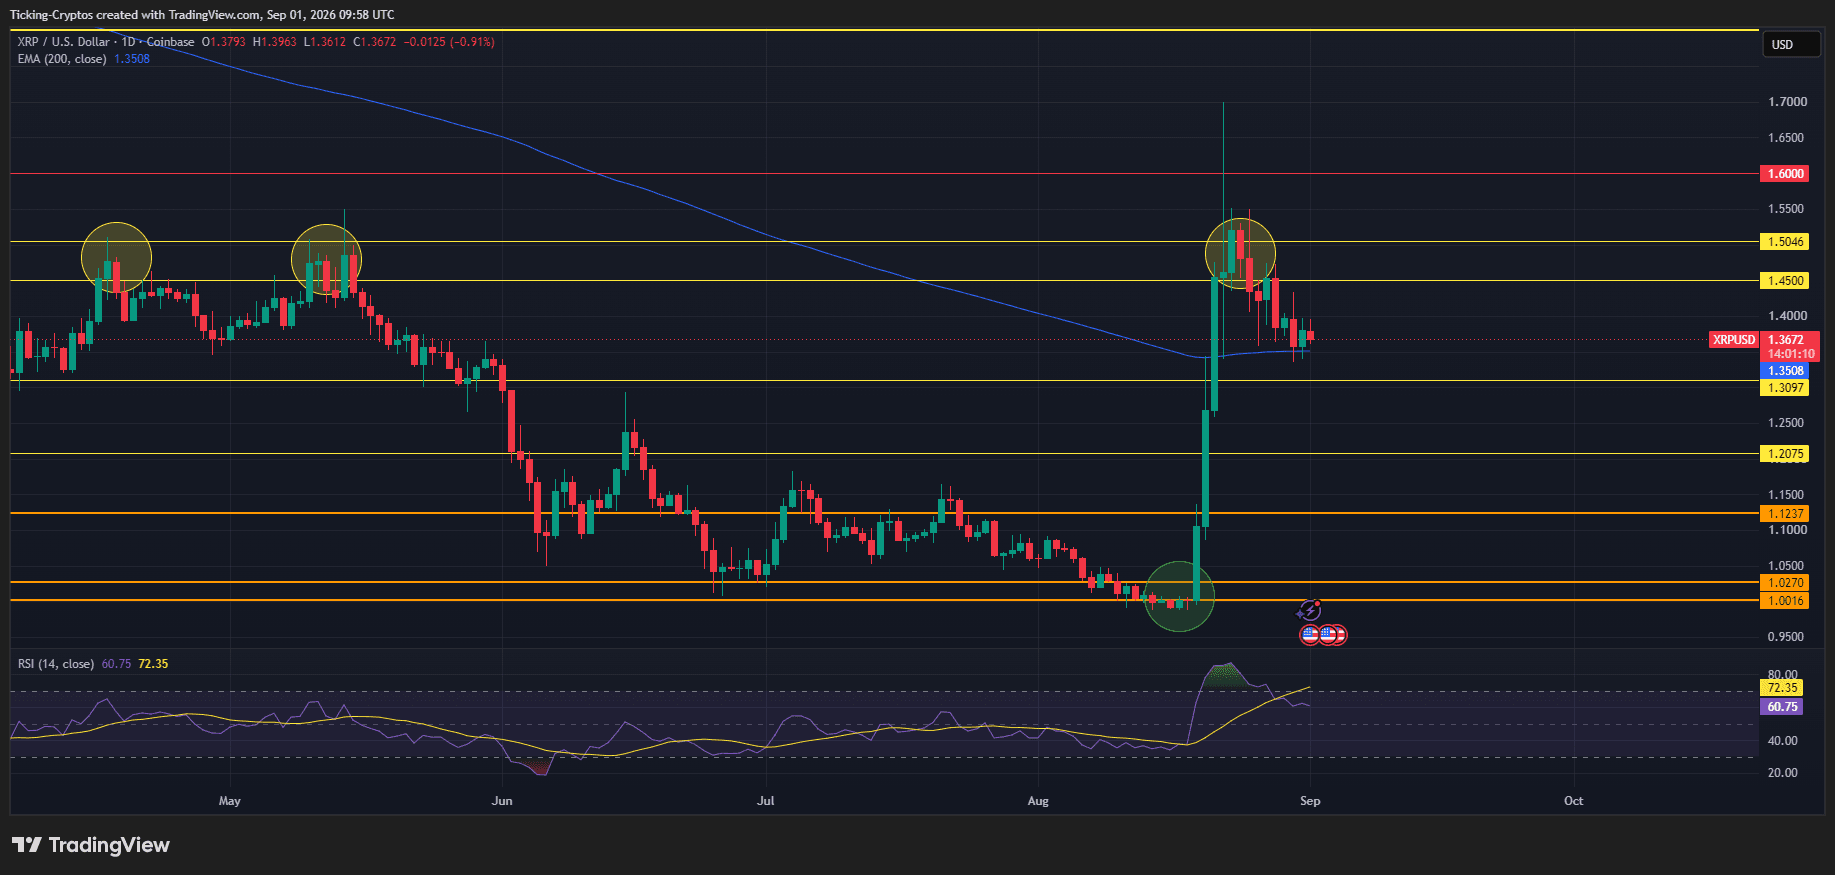
One structural point that traders keep missing: the move from $1.00 to $1.70 happened in days. There is almost no traded volume in the entire $1.05 to $1.35 zone. If $1.3508 fails and $1.3097 goes with it, there is very little underneath to slow price down. That cuts both ways, but it is why the risk here is not symmetrical with the reward.
Worth knowing, especially since today is the first of the month.
Ripple holds most non-circulating XRP in escrow contracts, and 1 billion tokens unlock on the first of every month. Historically Ripple re-escrows the bulk of it, typically 600 to 800 million, which leaves roughly 200 to 400 million actually entering circulation. Around 37.5 billion XRP remains locked, against circulating supply of about 62.53 billion out of a 99.99 billion total.
At today's price of roughly $1.37, that net monthly release is worth somewhere between $270 million and $550 million of new supply arriving whether the market wants it or not.
Put that next to the ETF numbers and the picture sharpens. The best ETF week of 2026 was $110 million. The monthly structural release is several times that. ETF demand is real, but it is currently not large enough to absorb the supply schedule on its own. That is not a scandal, it is arithmetic, and it is a headwind that Bitcoin simply does not have.
Nobody can answer that for you, and anyone who says otherwise is selling something. What can be done is to lay out what the position actually is, because most people buying XRP here do not realise what they are betting on.
If you are weighing this, the questions worth answering first are: are you actually taking a view on long-end Treasury yields, do you have a level at which you accept you were wrong, and would you be comfortable holding through a retest of the $1.20 area, because the chart structure makes that entirely possible without the bull case being dead.
Three dated events will settle most of this.
Add the ongoing ETF flow prints and the 30-year yield, and you have a fairly complete dashboard. Watch those rather than the price alone.





