
XRP is showing signs of recovery, following a technical formation. XRP still remains above an important resistance area, which is a positive sign for further appreciation. However, the overall trend is bearish; hence, future performance will be contingent on the strength of the breakout.
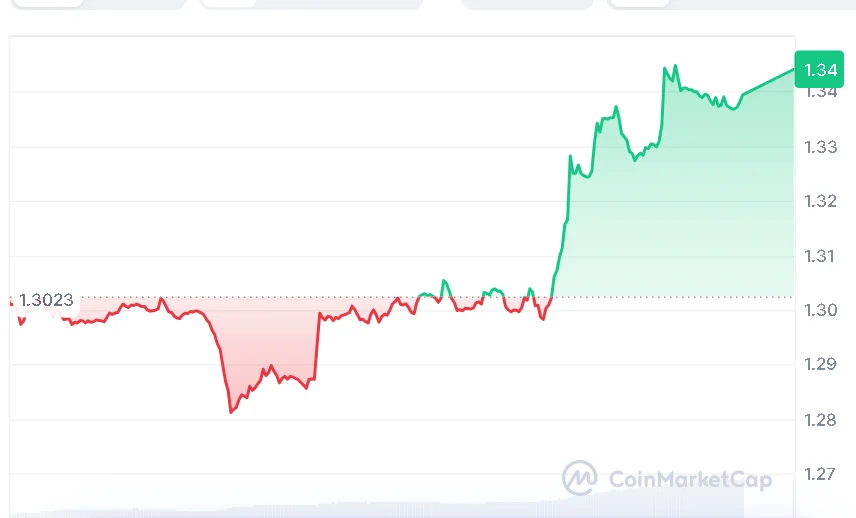
At the time of writing, XRP is trading at $1.34, recording a 24-hour trading volume of $2.78 billion and a market capitalization of $82.29 billion. The token has a modest 3.05% gain over the last 24 hours, suggesting that buyers are slowly stepping back into the market.
Also Read | Chainlink (LINK) Range-Bound Trading Signals a Short-Term Rally Toward $9.55
On April 6, 2026, Alpha Crypto Signal, a crypto analyst, gave a short-term prediction and indicated that XRP had successfully emerged from a falling wedge formation on the 4-hour chart. A breakout from a falling wedge formation can usually be regarded as a change in the direction of the prevailing trend, particularly since the price is now trading above its upper boundary.
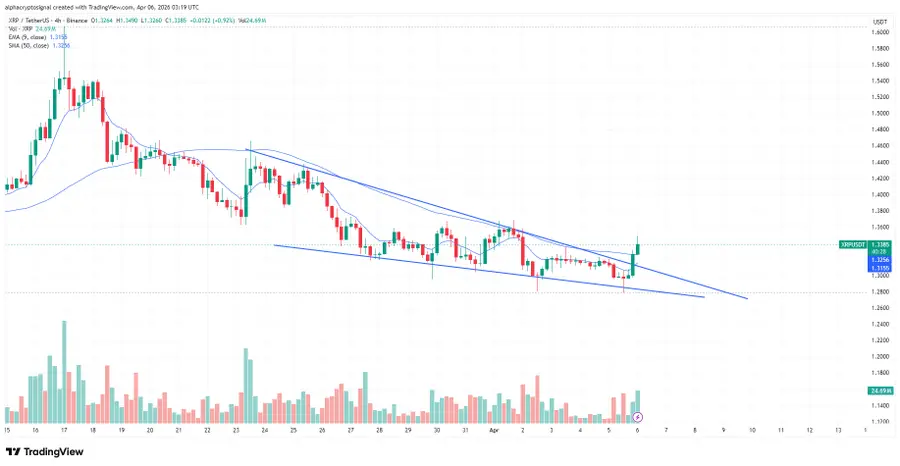
XRP is currently trading above this breakout region, and it is providing support to the price. So long as the price remains above this level, the next target for XRP would be the $1.38-$1.42 region. This price action is further strengthened by an increase in volume and momentum.
Nevertheless, Alpha Crypto Signal noted that there is also the possibility of a reversal. Should XRP fall below its breakout point and return within the wedge structure, it could prove to be a failed breakout, putting downward pressure on the cryptocurrency.
Although the recent surge was significant, the bigger picture is still weak. The price of XRP is presently trading close to $1.3398, whereas its RSI is at 43.97, which is under the neutral level of 50.
Price is still trading below important moving averages, including the 20-day SMA of $1.3693 and the 50-day SMA of $1.3906. Meanwhile, the 100-day SMA is standing at $1.6079, while the 200-day SMA stands at $1.9832.
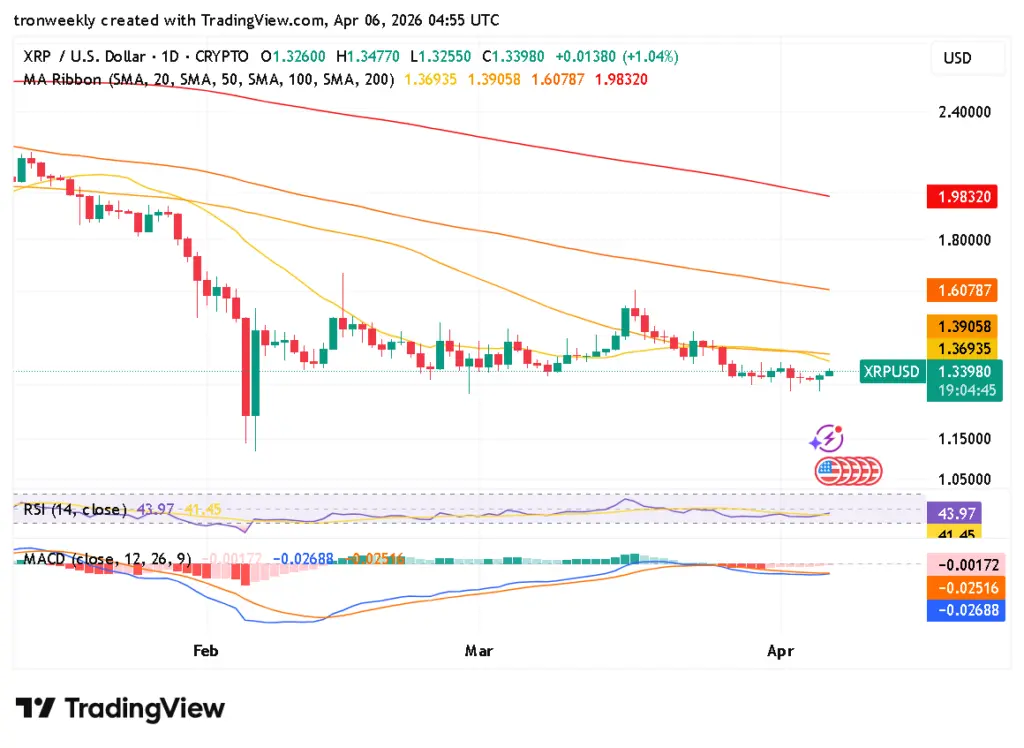
The momentum indicators also show the same conservative behavior. The MACD is currently trading in negative zones, where the MACD line stands at -0.0269 below the signal line, which is at -0.0252. Despite the fact that the histogram is beginning to look better, it is still in negative zones.
Overall, XRP seems to be at a crucial juncture. Although the break from the lower end provides optimism for potential profits, the general trend requires greater evidence to ensure that a reversal to an uptrend is in place.
Also Read | Aptos (APT) Breaks Key Resistance: Is a Bullish Rally Toward $3.90 Next?

