
XRP is still experiencing selling pressure, and the market signals are favoring the bears. Although the asset has managed to stabilize at key support levels, the buying pressure has not been enough to change the market trend significantly.
The broader structure shows XRP stuck within a descending channel that has held for months. This trend has restricted the price from going higher and has kept the overall market sentiment subdued.
On Sunday, the token currently trades at $1.36, having failed to move past the mid-channel resistance and the 100-day and 200-day moving averages.
Both the major moving averages now act as the token’s dynamic resistance levels at $1.80 and $2.20, respectively. Until the token closes past these levels, the overall market sentiment remains bearish. The token’s attempt to move higher remains restricted, and the market awaits a proper move instead of a mere reaction.
Support between $1.10 and $1.20 is still the focus in the short term. This range corresponds with the lower boundary of the trading channels and has seen demand in the last few sessions. A decisive close below here could trigger a deeper correction and continue the existing trend.
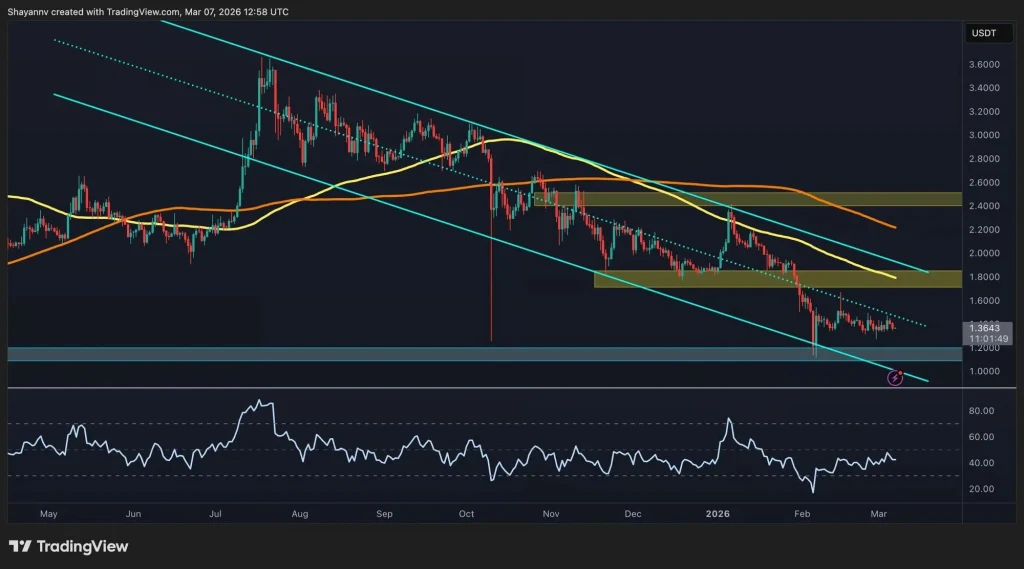
Source: TradingView
Analyst Egrag Crypto highlighted that the 21-day EMA recently crossed below the 50-day EMA. He noted that this cross usually means a bearish continuation for the price of XRP in previous cycles.
Past examples have seen the final dump after the cross. This action has represented the true market bottom. In the last case, the decline has represented about 17% from the local low. This pattern has established a baseline for traders who are currently observing the current action.
Also Read: XRP Holds Strong Above $1.41 as ETF Filing Lifts Institutional Sentiment
This cross has appeared once again within the market action. If the pattern were to play out, XRP could once again fall to lower support levels.
Egrag also highlighted the $0.91–$0.85 price range as a possible sweep zone, noting that this price range aligns with the falling wedge support and could attract price before any meaningful momentum change.
The invalidation markers remain unchanged. A close above $1.80 on the daily chart and a close above $2.00 on the weekly chart would suggest that the price has already formed a market bottom for XRP.
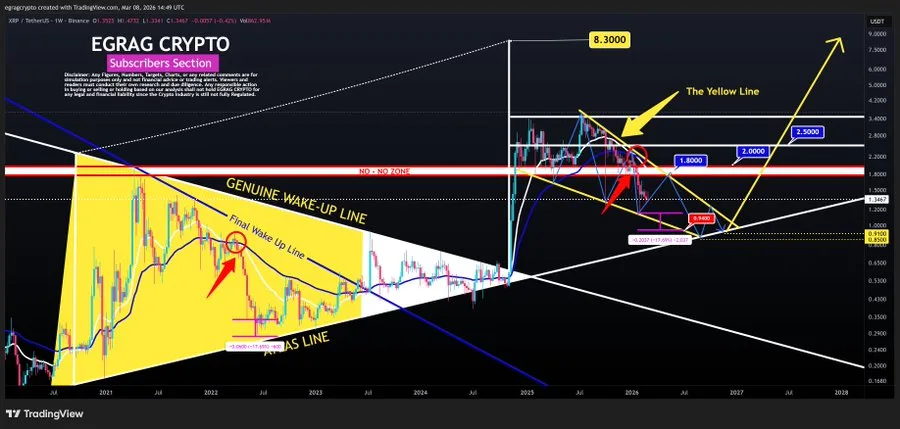
Source: X
A long-term symmetrical triangle pattern continues to be respected on the higher timeframe charts. The measured move from this pattern continues to be respected at the $8.50 level. This structure remains active and provides context to any longer-range projections.
Short-term volatility seems probable as traders gauge the reactions to support and resistance levels. One more downside sweep remains possible under current conditions.
Despite the near-term pressure, the macro pattern has not been breached, and analysts continue to monitor any signals for the next major move.
Also Read: Bitcoin Range-Bound Between $62,000-$72,000 Ahead of Decisive $60,000 Test

