
XRP is testing a historically significant level of support today and is showing early signs of stability in the market. Experts have observed that the asset’s 100-Day Exponential Moving Average has often represented support throughout past price cycles and could potentially be preparing to begin another accumulation pattern.
At the time of writing, XRP is trading at $1.36 with a 24-hour trading volume of $3.69 billion and a market capitalization of $83.29 billion, according to CoinMarketCap. Market momentum is gradually improving, suggesting that buyers may step in if the 100 EMA continues to hold as support.

Source: CoinMarketCap
Crypto analyst EGREG CRYPTO shared his insights about the price cycles of XRP. He emphasized the need to observe the 100 EMA, a zone where the price of XRP has always found support before entering a new bull run.
XRP received support at the 100 EMA in 2017 before the parabolic run. XRP formed a base at the 100 EMA in 2021 before the next run. XRP is currently in the third cycle of 2026 and is heading for the 100 EMA, which may be another accumulation period.
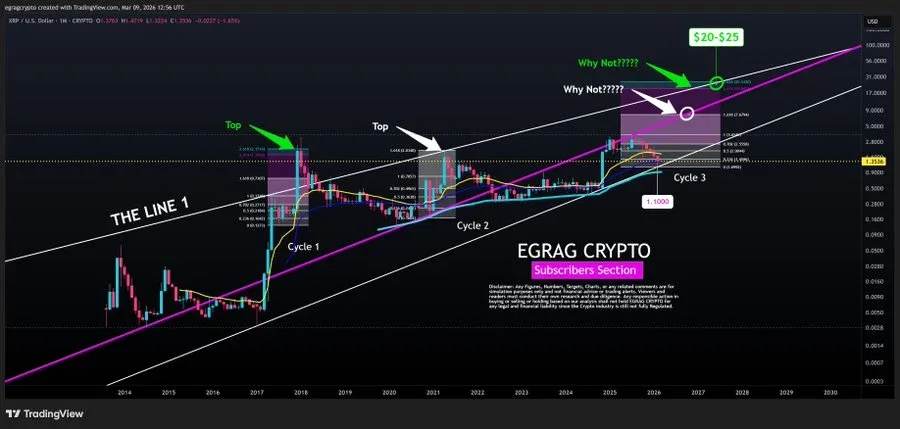
Source: X
Looking at the long-term price chart for XRP, we notice that it forms a repetitive ascending channel where the price usually touches the mid-lower band before moving towards the upper band in a bull run. Currently, the price is touching the support area for a potential uptrend.
From a technical perspective, there are two scenarios of expansion using the Fibonacci method. One is similar to the 2021 cycle, aiming at the 1.618 expansion, with prices ranging from $6 to $9.
In the second case, as in the expansion of 2017, it is expected that the XRP rate will move towards the 2.414-2.618 extension levels, at which it could be at around $20-$25. The upper end of this range could be achieved with strong market momentum.
From the technical indicators, it is clear that XRP is stable. RSI is at 42.84, just above the signal line at 41.78. This shows that there is an improvement in buying activity. However, it is still below the neutral line at 50. It is getting support, but is not going into a bullish zone.

Source: TradingView
The MACD is still negative with the MACD line at -0.04544 and the signal line at -0.05449. The histogram is slightly positive at 0.00905.
Also Read | Uniswap Price Prediction 2026-2032: Will UNI Keep Steady?
Overall, XRP seems to be stabilizing around a critical level of historical support. Going by the past patterns, this might be the starting point of a gradual recovery, and the potential resistance levels might be in line with the Fibonacci extension.
Market participants are advised to monitor whether the price will respect the 100 EMA support once again, as the previous cycles have shown a pattern of accumulation before a strong price move.
Also Read | Bittensor (TAO) Tests $200 Resistance as Buying Momentum Signals Potential Upside


