
Yesterday, as expected, the Fed lowered its rate from 4.25%–4.50% to 4%–4.25%. Although rate cuts are generally seen as supportive for gold, the XAU/USD chart shows bearish price dynamics: after a short-term spike above $3700 (a new all-time high), gold retreated sharply, forming a long bearish candlestick (marked with a red arrow).
This may be explained by the fact that expectations of a rate cut had already been priced in, while at the press conference the Fed Chair struck a less “dovish” tone than the market had hoped for. While Jerome Powell did voice concerns about the labour market, he gave no clear signal of readiness for aggressive or rapid further cuts.
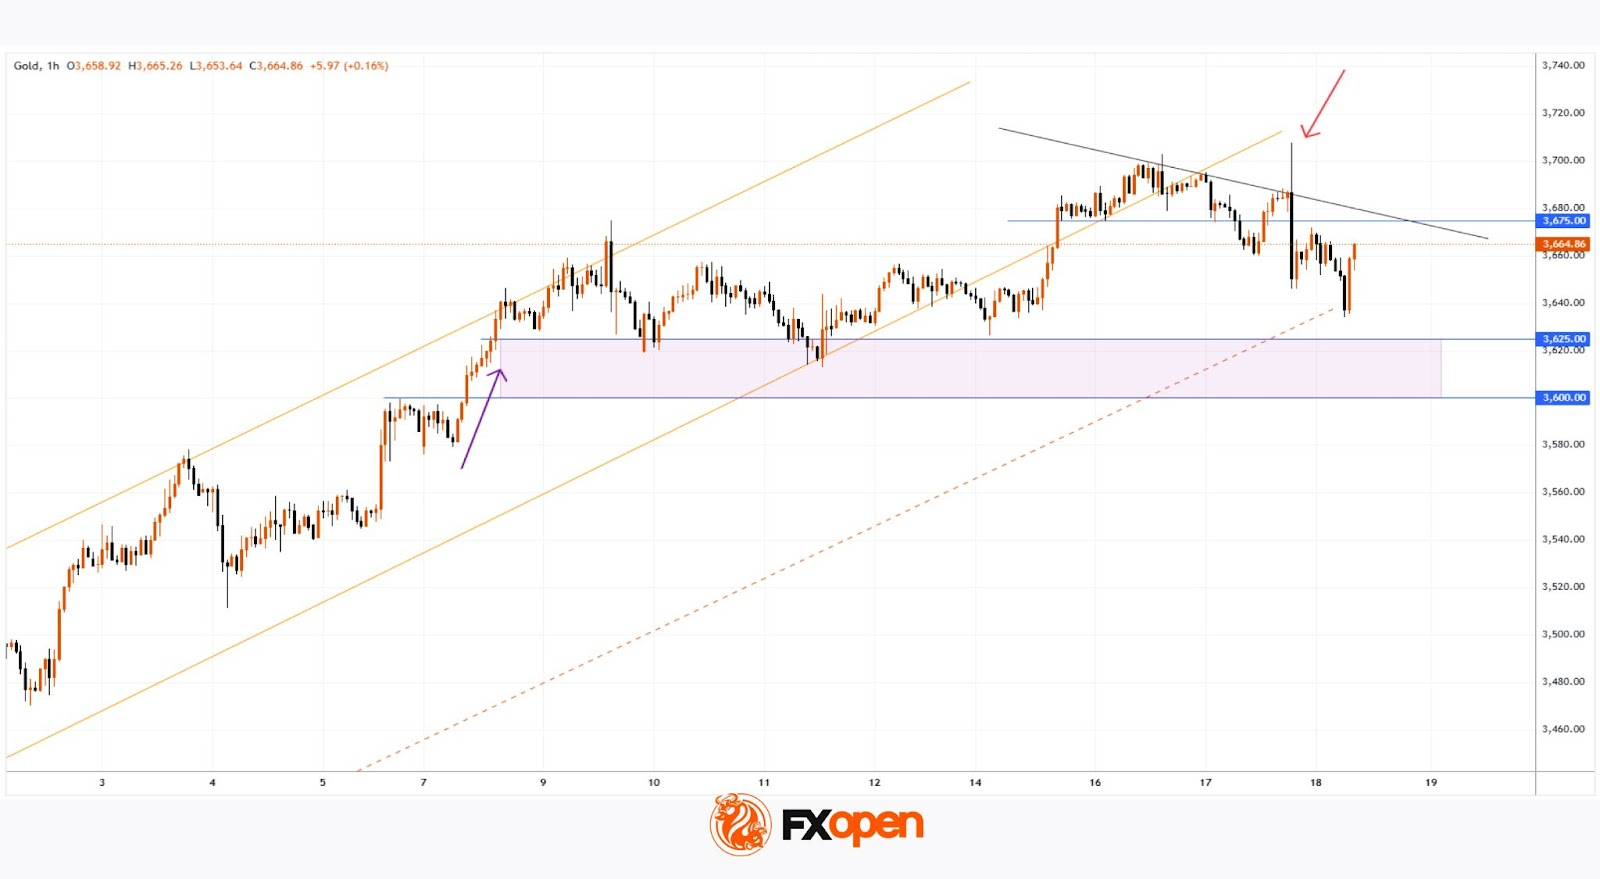
Technical Analysis of the XAU/USD Chart
At the start of the week, we:
→ drew a steep ascending channel (shown with orange lines);
→ suggested a potential move lower towards the orange dashed line (an additional support line plotted beneath the channel).
Indeed, the dashed line acted as support today. What are the possible scenarios?
Bearish view:
→ the long upper shadow of the candlestick marked with the arrow clearly points to strong selling pressure;
→ the price only briefly broke above the psychological $3700 level – a bull trap (or Liquidity Grab in Smart Money Concept terms);
→ $3675 has flipped from support to resistance.
Bullish view:
→ the dashed trendline has confirmed its role as support – it may help the price move towards the midline of the orange channel;
→ the $3600–$3625 area looks like solid backing. Following the rally in early September, gold repeatedly found support there without falling below it.
Considering that in early September the price was around $3450, the market still looks bullish overall. However, as we recently outlined three reasons why gold’s advance could stall, it now seems that the black line, drawn through lower lows, may serve as another bearish signal – this time on the lower timeframe.

