
Yesterday, the BTC/USD chart saw sharp price swings during the US trading session:
→ first, Bitcoin rose by more than 3%;
→ shortly afterwards, it dropped by over 4%.
The main impulses unfolded within just a few hours and triggered liquidations on both long and short positions. In total, around $450 million worth of positions were liquidated across Binance and other crypto exchanges. As a result, on the daily BTC/USD chart, yesterday’s candle resembles a pin bar with a long upper wick, which is typically viewed as a bearish signal.
Notably, it is difficult to identify clear fundamental drivers for the crypto market at this time, aside from growing rumours about a potential military conflict between Venezuela and the United States.
However, looking at the broader, long-term context of the BTC/USD chart provides important clues as to what this price action may signify.
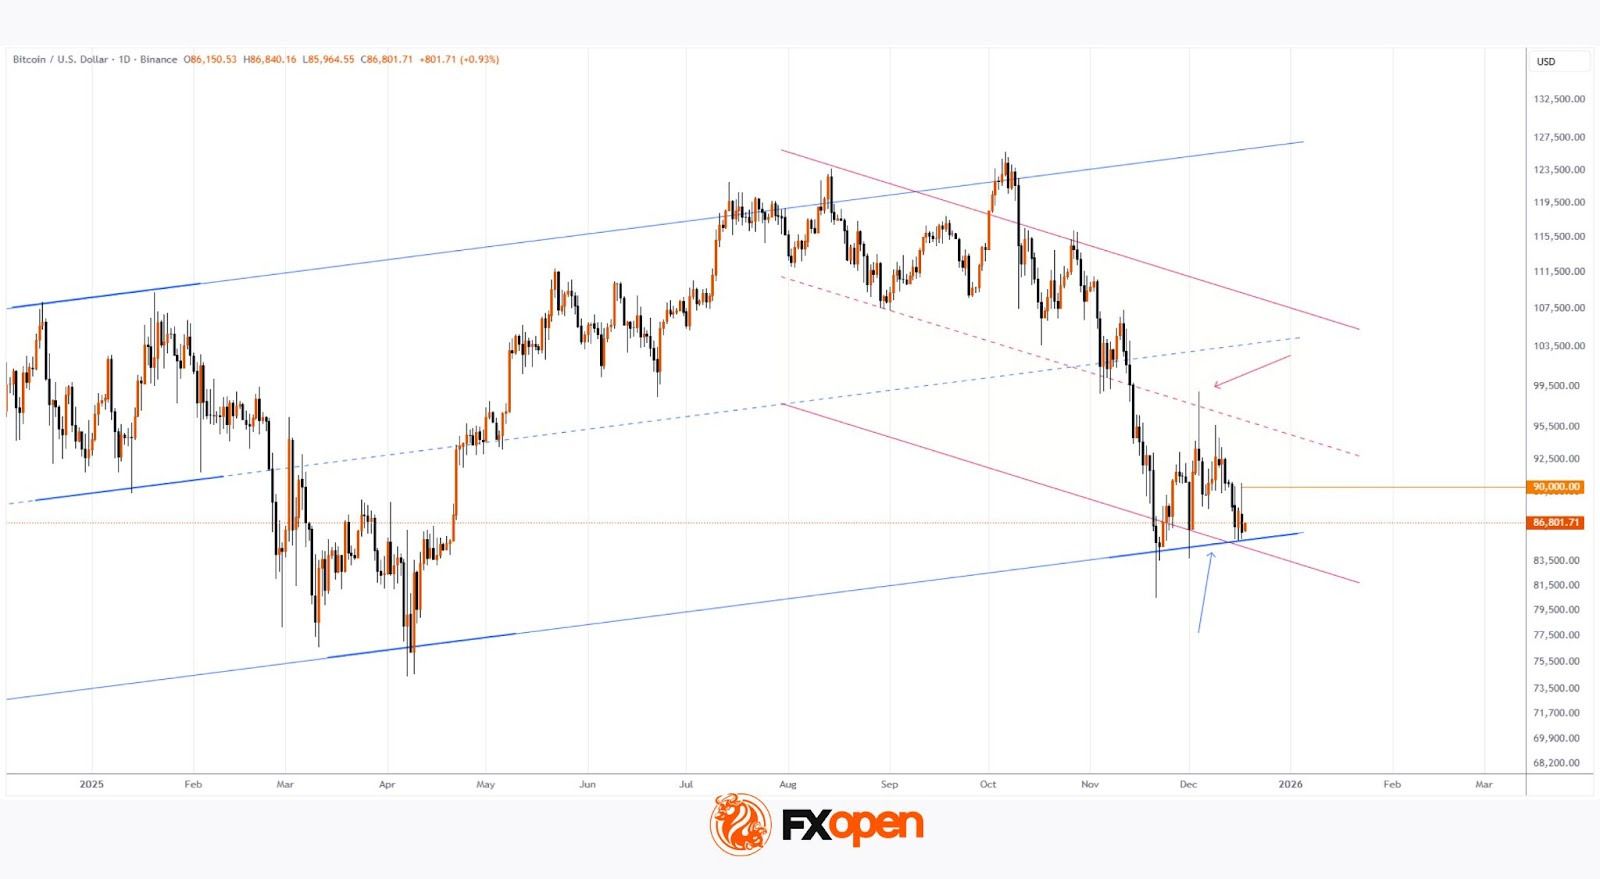
When a long-term ascending channel is plotted (shown in blue), it becomes clear that Bitcoin’s price is trading near its lower boundary, which has been acting as support since mid-November (marked by the blue arrow).
At the same time, at the peak of yesterday’s rally, the price made a false bullish break above the psychological $90,000 level, as well as above the high of the bearish candle from 15 December. This allows the move to be interpreted as a bearish liquidity grab.
Taken together, these factors suggest that so-called “smart money” is applying increasing pressure on the lower boundary of the blue channel.
Therefore, traders may wish to consider a scenario in which Bitcoin develops further bearish momentum within a descending channel. This channel was first outlined in an analytical note a month ago, has since been extended lower, and its median line has acted as resistance (highlighted by the red arrow), confirming the relevance of this structure.

