
You have a strategy. You know the cycles. You know markets overreact — in both directions — and that after every storm, the sun comes back out. So you wait. Patiently. Disciplined.
That’s exactly the problem.
There’s a moment in every waiting game when “I’m waiting for the right time” quietly turns into “I missed the right time” — without anything dramatic happening on the calendar. No bang, no headline. Just a date that passes, one you only recognize as the turning point in hindsight.
With Bitcoin, that moment may already be behind you.
(Disclaimer: This is a mathematical analysis, not financial advice.)
The setup is quick to tell: on July 10, 2025, Bitcoin hit its all-time high of $124,753. Today, less than a year later, it’s trading around $65,900 — nearly half gone.
Anyone who knows Bitcoin’s history knows the pattern: after every halving, the price dropped significantly below its previous high before the next rally began.
- After the 1st halving: up to 87% below ATH
- After the 2nd halving: 84%
- After the 3rd halving: 78%
Each cycle a bit milder than the last — but the pattern is clear. Follow it strictly, and this cycle could theoretically still see up to another 66% discount.
The conclusion practically writes itself: wait it out. The real dip is still coming.
But what if that conclusion rests on an assumption that’s no longer true?
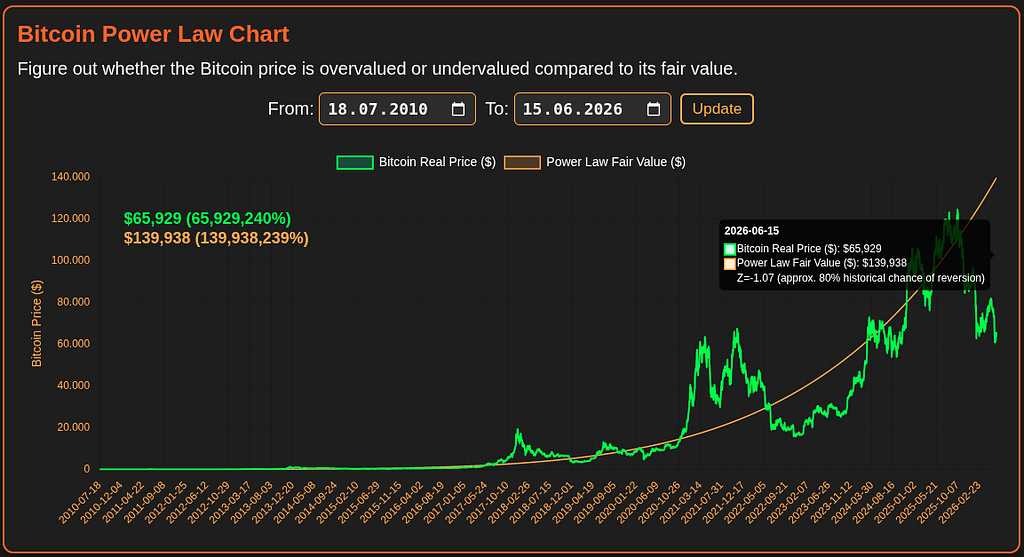
This is where the Bitcoin Power Law comes into play — one of the best-documented pricing models for Bitcoin, with a model fit based on 17 years of price history and a steadily increasing coefficient of determination (R² = 0.94).
The model doesn’t just describe a “fair value” — it also describes a statistical floor, a level below which the price is unlikely to fall. And that floor isn’t a fixed number. It’s moving, currently rising by about $123 per day.
That means today’s price of $65,900 isn’t necessarily a stop on the way down. It could already be the floor. Not in the sense of “Bitcoin will never fall again” — but in the sense that, past a certain point, it becomes statistically less and less likely you’ll ever see this price again.
And that point can be dated.
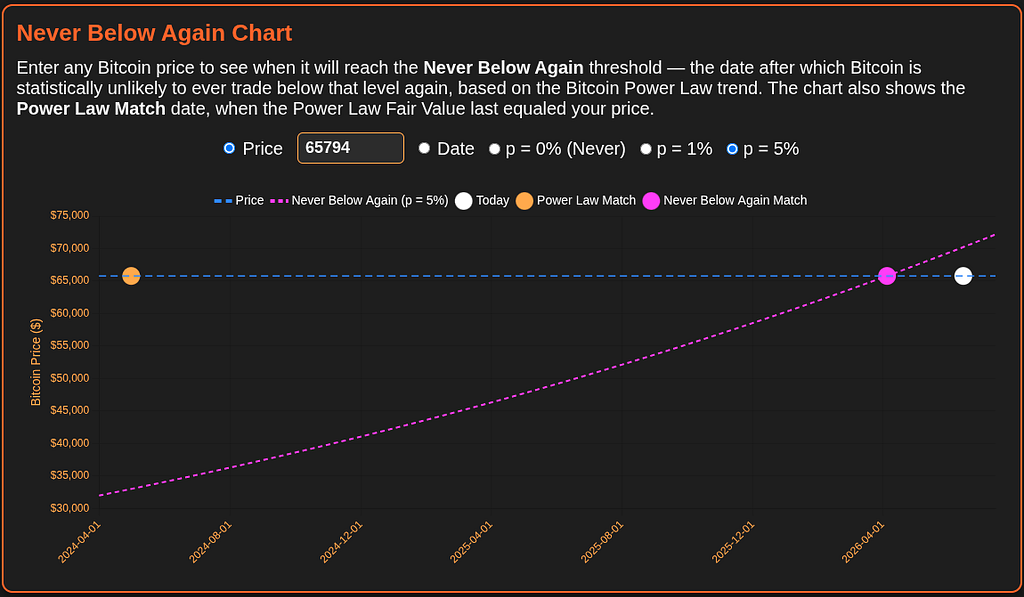
The model allows for a concrete question: at what point does falling back below today’s price become a statistical exception? The answer comes in three stages — like a closing window:
- April 4, 2026 — from here on, the model puts the probability of seeing $65,794 again at around 5%
- September 7, 2026 — that probability drops to around 1%
- January 23, 2027 — the probability approaches zero
The first threshold isn’t a future event. It’s already about two months behind you.
Does that mean the price can’t fall further? Of course it can. Models aren’t guarantees, and 5% isn’t zero. But it means: if you’re waiting for a lower entry point than today, you’re increasingly waiting — according to this model — for something whose probability is running against the clock, not with it.
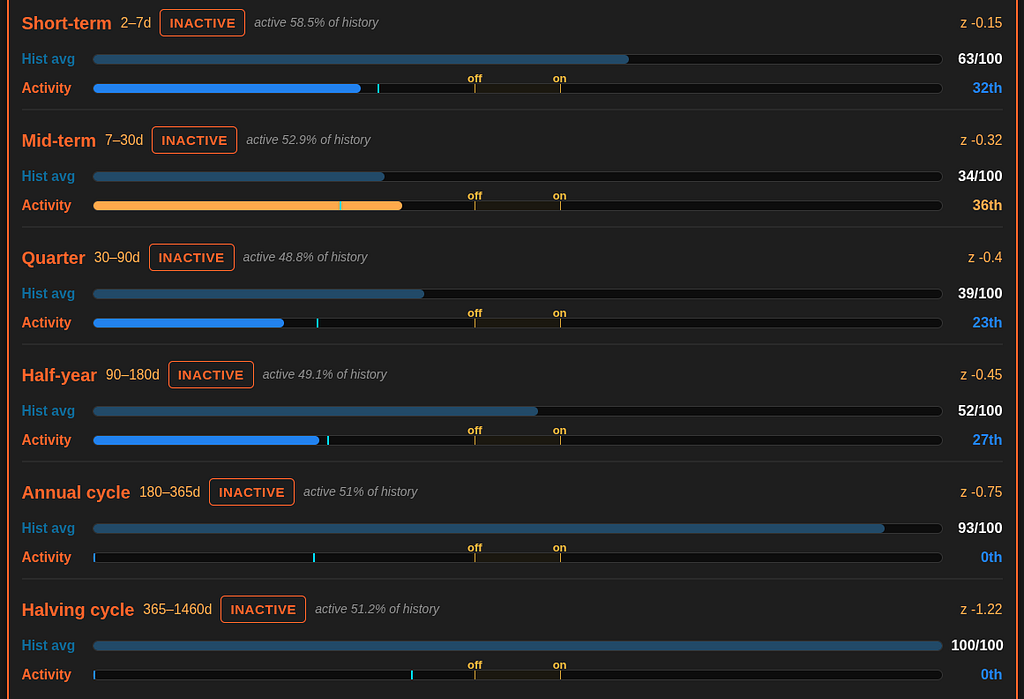
A second look at the current state doesn’t make things more comfortable. The Cycle Activity Monitor measures how strongly different time-based rhythms — from a few days up to the full halving period — currently show up in the price action.
The result: across all six timeframes, the monitor reads “inactive.” The longer rhythms stand out the most: the annual and halving cycles historically sit in the 93rd and 100th percentile of activity for this phase — right now, both sit at 0.
In other words: exactly the rhythms that historically swing hardest at this point in the cycle aren’t swinging at all right now. By its own historical standards, the market is unusually quiet — low-energy, with no clear trend in either direction.
That’s not a sign of safety. If anything, it’s the opposite: this is what a market looks like just before it breaks — up or down.
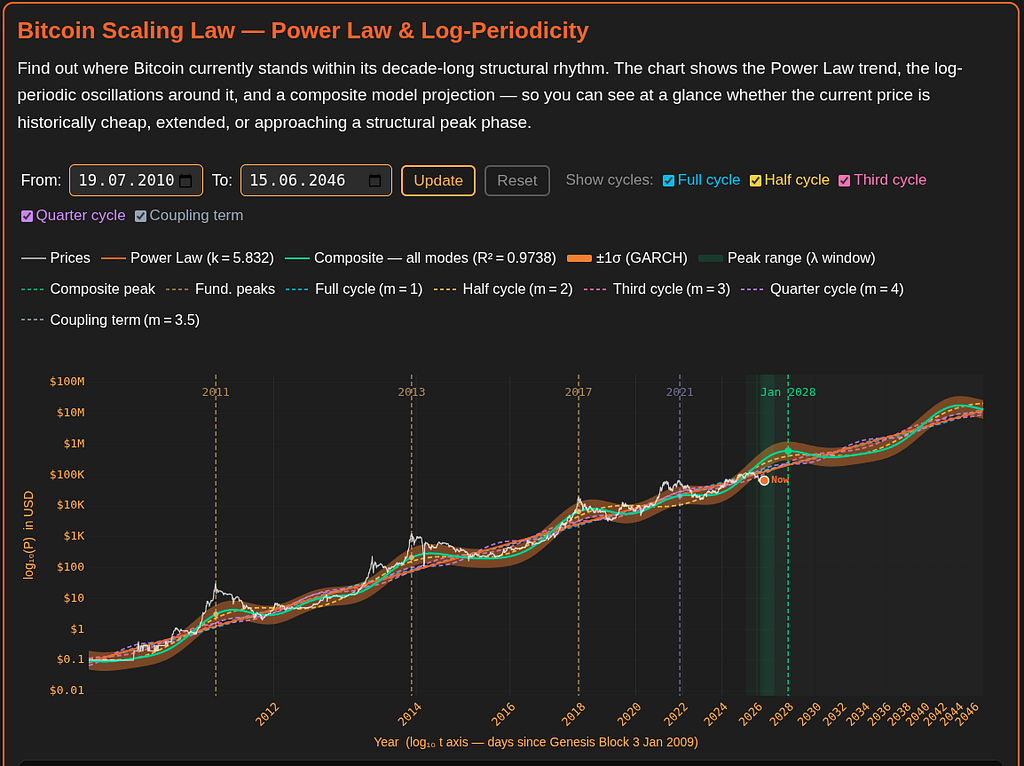
Here’s where it gets uncomfortable. Giovanni Santostasi and Stephen Perrenod, who developed the extended Power Law model, make a claim that runs against the classic “4-year cycle” narrative: what looks like an ordinary bear market might actually be the overlap of several independent rhythms — short-, medium-, and long-term cycles that layer on top of each other like wave patterns on a pond, creating a pattern none of the individual cycles would explain on their own.
Add those rhythms together, and a different picture emerges: this cycle’s real low already happened in late 2023/early 2024 — not now, and not in the future. The composite model projects the next peak for January 2028, at a level significantly higher than the current trend.
Right now, Bitcoin sits roughly 53% below this fair-value trend (Z ≈ -1.07). Historically, the probability of a correction back toward trend from a comparable level has been around 80%.
If you’re waiting for the “real bear market bottom,” you might be waiting for something that, according to this model, has already happened — it just didn’t feel like it at the time.
You want more Bitcoin. That was the starting point.
The question isn’t: can the price still fall? Of course it can.
The question is: does the potential extra discount justify the risk of missing the move if you’re wrong?
Bitcoin’s biggest price moves have historically concentrated in extremely short windows. Miss those windows, and you don’t just miss “some upside” — you miss most of the entire cycle. That’s not a gut feeling; it’s the structure of this asset.
No one knows the exact bottom. Not you. Not me. Not the model.
But the model knows the rising floor, the closing window — and the probability that, from here, you’d be in the green.
The question isn’t whether you buy anymore. The question is whether you’re still around when the window closes.
→ If you’d rather run the numbers yourself than wait: SatoshisQuest.org
The Bitcoin Dip You’re Waiting For Is Already Costing You Money was originally published in Coinmonks on Medium, where people are continuing the conversation by highlighting and responding to this story.

