
Zcash (ZEC) continues its upward momentum as of March 30, 2026, with steady bullish sentiment. The token has gained 4.95% over the past 24 hours, showing renewed buying pressure and strengthening investor confidence across the market.
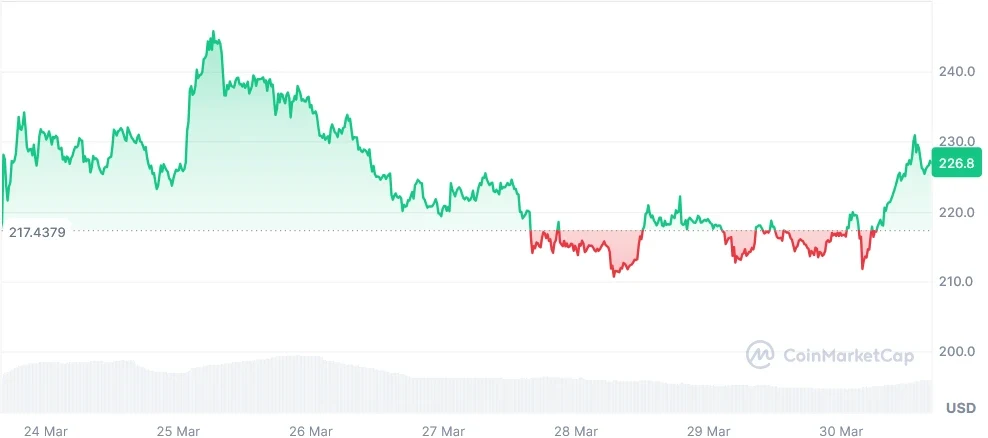
At the time of writing, ZEC is trading at $226.58 with rising activity. According to CoinMarketCap data, the 24-hour trading volume reached $301.58 million, up 31.07%, while market capitalization stands at $3.76 billion, increasing 5.94%.
Also Read: Zcash (ZEC) Eyes 8.68% Surge Amid Bearish Pressure
ZEC continues to trade within a symmetrical triangle on the 4-hour chart, coiling beneath a descending higher timeframe trendline.
Current action sits at a heavy confluence around the 0.5 Fibonacci, VWAP, and prior range equilibrium, forming a dense resistance cluster that typically rejects weak continuation attempts without participation.
As the volume diminishes as it approaches this test, it appears to be more of a grab for liquidity than a true breakout.
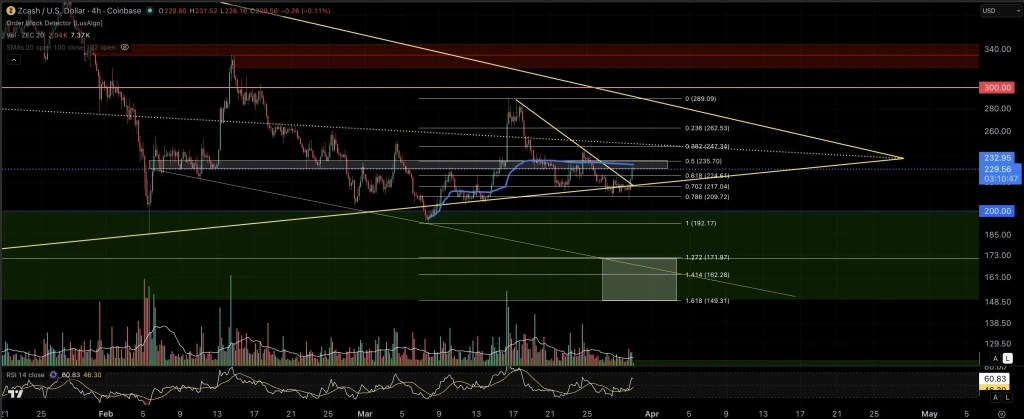
The move appears to have taken out all the nearby highs and trapped longs, a common characteristic of this asset before it rolls back to lower liquidity and support zones.
If this rejection is firm, it indicates further downside objectives in the 217, 210, and 200 psyche areas. Further downside is also possible in the 170-150 range.
According to the crypto analyst @XRPathologist, if bulls can re-establish 245-250 with strong volume, it opens doors to 262, 289, and potentially 300 resistance.
The momentum indicators are showing signs of an upcoming change in the tide. The MACD chart is showing diminishing downward pressure as the histogram approaches zero at -0.20417.
It is also showing that the MACD line, which is currently at -5.07981, is closing in on the signal line, which is at -4.87564. This could be an indication of a possible bullish crossover developing, showing diminishing selling pressure in the market.

Currently, RSI is at 48.64. The momentum is neutral and slightly below the middle point. However, it is increasing from the latest lows.
The rise in the low levels indicates a mild bullish divergence. The buying is taking over the reins once again. However, the buying strength is low and needs to pick up.
While a confirmed breakout through resistance could see a strong increase in buying, a rejection could see a liquidity-driven pullback towards lower support levels.
With momentum increasing and participation levels rising, traders are positioning themselves in anticipation of an increase in volatility.
This article contains market analysis and price predictions. These are not guarantees. Crypto markets are volatile. Always DYOR. Not financial advice.
Also Read: Zcash (ZEC) 17% Surge Despite Bearish Market Signals


