
Zcash (ZEC) experienced immediate price volatility following its listing on Robinhood, as retail traders reacted quickly, as of 24 April 2026.
The addition drove a short-term surge, highlighting strong demand for privacy-oriented digital assets among everyday investors entering crypto markets through accessible platforms.
The listing allows users of the Robinhood app to buy and hold Zcash alongside major assets like Bitcoin and Ethereum.
This move reflects increasing interest in diverse digital assets within regulated US frameworks and signals broader adoption trends among mainstream investors.
Also Read: Zcash (ZEC) Holds $337 After Market Pullback: Can it Rebound Toward $450?
ZEC is currently trading at $344, up 8.45% over the past 24 hours. The 4-hour chart shows a broader macro downtrend defined by a descending trendline, with price rebounding strongly from the $180–$200 demand zone after completing an ABC correction structure.
A five-wave impulse formed upward, suggesting a potential trend shift or larger corrective structure continuation scenario.
The Price is now reacting within a key Fibonacci retracement zone: $341, $311, and $288. This confluence aligns with the trendline retest and current support.
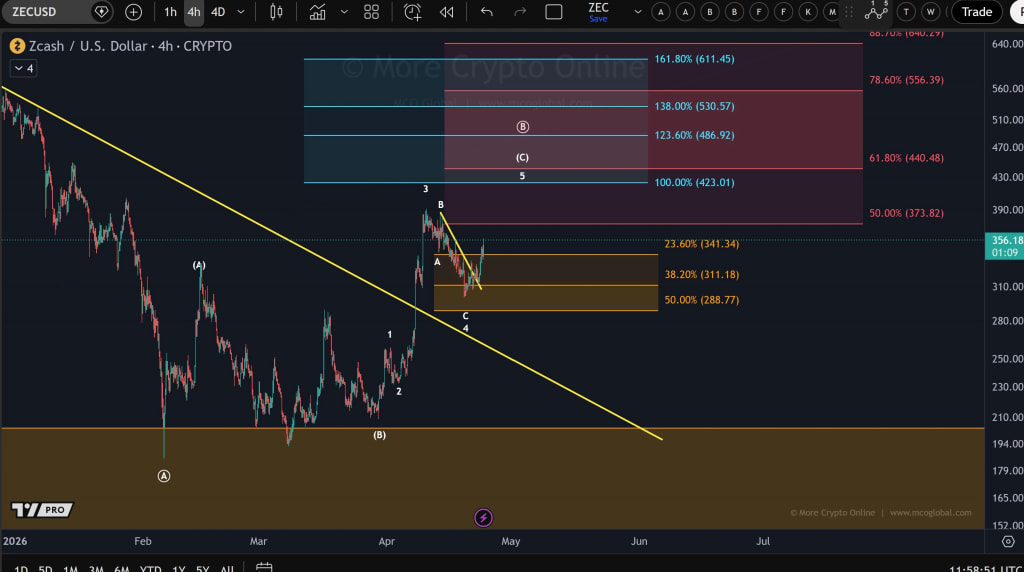
Holding above $311–$288 keeps the bullish structure intact, while losing $288 risks revisiting the $200 demand region.
According to the crypto market expert More Crypto Online, there are a few upside levels that include $373, $423, $440, $486, $530, $556, and $611.
A breakthrough beyond the $360-$370 region will enhance bulls’ hopes for continuation. In case the price meets resistance at this level, the possibility of moving lower is not out of the question.
From an indicator perspective, RSI is currently trading at 64.14 levels with its trigger around 62.36 levels, indicating moderately high momentum without being oversold.
However, the rising line indicates an active market of buyers, although the upward trend towards the upper 60’s suggests that there could be a small correction on the momentum front.

MACD stands at 17.87343 and trails the signal line, which is at 20.69890, while the histogram is at -2.82547.
The negative divergence shows that the upward momentum is weakening. Even though it is positive, the crossover indicates a weakening trend and possible bearishness in the near term.
This article contains market analysis and price predictions. These are not guarantees. Crypto markets are volatile. Always DYOR. Not financial advice.
Also Read: Zcash (ZEC) Outlook Strengthens: Can Bulls Drive a Rally Toward $480?

