
Zcash (ZEC) maintains upward momentum as of April 5, 2026, extending its recovery across both short-term and weekly timeframes.
The token rose 3.73% over the past 24 hours, reflecting renewed buying interest, while broader market sentiment continues to improve alongside rising participation.
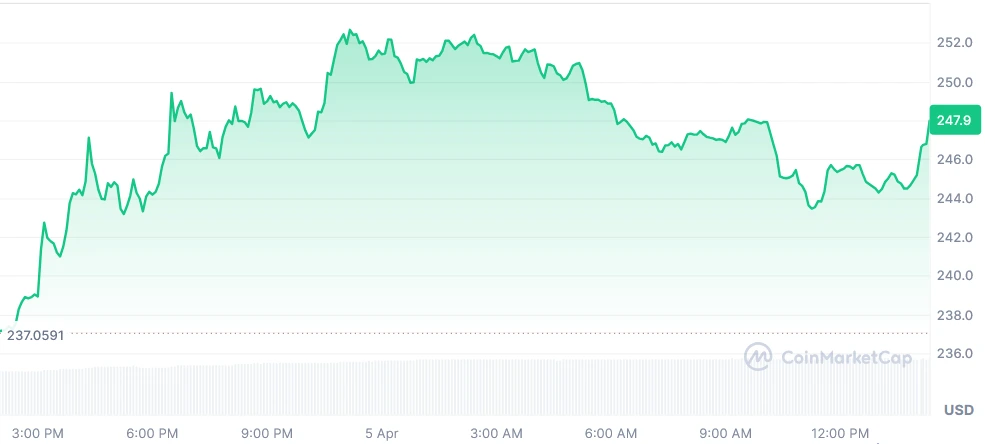
At the time of writing, ZEC is trading at $247.9, supported by increased activity across the market. The 24-hour trading volume stands at $266.81 million, up 29.07%.
Market capitalization reaches $4.08 billion, marking a 3.94% rise and reinforcing strong bullish momentum, according to CoinMarketCap data.
Also Read: Zcash (ZEC) Eyes 8.68% Surge Amid Bearish Pressure
ZEC is showing signs of exhaustion after a massive parabolic rally that topped near $750, followed by a brutal correction phase.
The market structure remains bearish, with consistent lower highs and lower lows. Price is still trading below key EMAs, keeping sellers firmly in control.
Right now, ZEC is stuck in a tight accumulation range around $187 after weeks of sideways action. Bulls are attempting to stabilize, but repeated rejections near the $230–$280 zone highlight strong resistance.

Volume has dried up, signaling weak momentum and indecision in the market. According to the crypto analyst Altcoin Sherpa. For a bullish shift, ZEC must reclaim $270–$280 and flip it into support.
If that happens, upside targets sit at $307 and $392. However, if $187 breaks down, expect another leg lower toward $150 and possibly $100. Trend remains bearish until proven otherwise.
From an indicator perspective, the RSI (14) is seen trading close to 53.97 with the signal line near 49.96, showing weak bulls. RSI is above the 50-level, showing buyers have the upper hand.
However, it’s not even close to overbought levels, thus providing further room for the stock to rally without experiencing severe exhaustion.

MACD is trading at 3.03064, and the signal line can be seen at 2.15003, with the histogram showing -0.88061. Despite the positive outlook, there seems to be a decline in momentum.
The decreasing histogram may suggest that we could be seeing some consolidation, or the beginning of a trend change.
The increase in prices and trade suggests that buyers are entering the scene, which might be the beginning of a reversal trend if this pace continues.
The ZEC coin is approaching an important resistance level, and a breakout from this level would boost momentum.
This article contains market analysis and price predictions. These are not guarantees. Crypto markets are volatile. Always DYOR. Not financial advice.
Also Read: Zcash (ZEC) Eyes 8.67% Surge Amid Market Fear

