Four 1-Minute Scalping Strategies: Ideas and Applications
15-Sep-2025
FXOpen Forex Blog | Forex trading, cryptocurrency trading
Scalping thrives on speed, accuracy, and disciplined execution. Strategies designed for the 1-minute timeframe are popular among traders who prefer to actively engage with the market. Effectiveness of ultra-short-term trading may demand a structured approach and swift decision-making. In this article, we examine four 1-minute scalping strategies and the tools and technical indicators that may support traders in navigating the fast-paced environment of intraday trading.
1-Minute Scalping: Basics
1-minute scalping is a fast-paced trading style focusing on taking advantage of small price movements within a minute timeframe. Traders using this approach rely on 1-minute charts to make quick, multiple trades throughout the trading session. The primary goal is to accumulate potential small gains that might add up to larger returns over time.
A scalp trading strategy requires a solid understanding of technical analysis and market conditions. Scalpers typically use indicators, price action patterns, and trend analysis to identify short-term market movements and potential entry and exit points. The rapid nature of 1-minute scalping demands precision and discipline, as even a slight delay can impact the trade outcome.
One of the advantages of 1-minute scalping is the ability to generate frequent trades, which can be particularly appealing during volatile market conditions. However, it also comes with higher risks due to the speed and frequency of trades, meaning risk management plays a significant role.
Scalpers should also be aware of transaction costs, as frequent trading can lead to significant fees, which may erode potential returns. Choosing a broker with low commissions, tight spreads, and fast execution speeds may help enhance a scalping forex strategy.
Four 1-Minute Scalping Strategies
Now, let’s take a closer look at four 1-minute trading strategies. To apply these strategies, see how they work in practice, and access each of these 1-minute scalping indicators, consider following along on FXOpen’s TickTrader trading platform.
Strategy 1: VWAP + MACD
Indicators Used
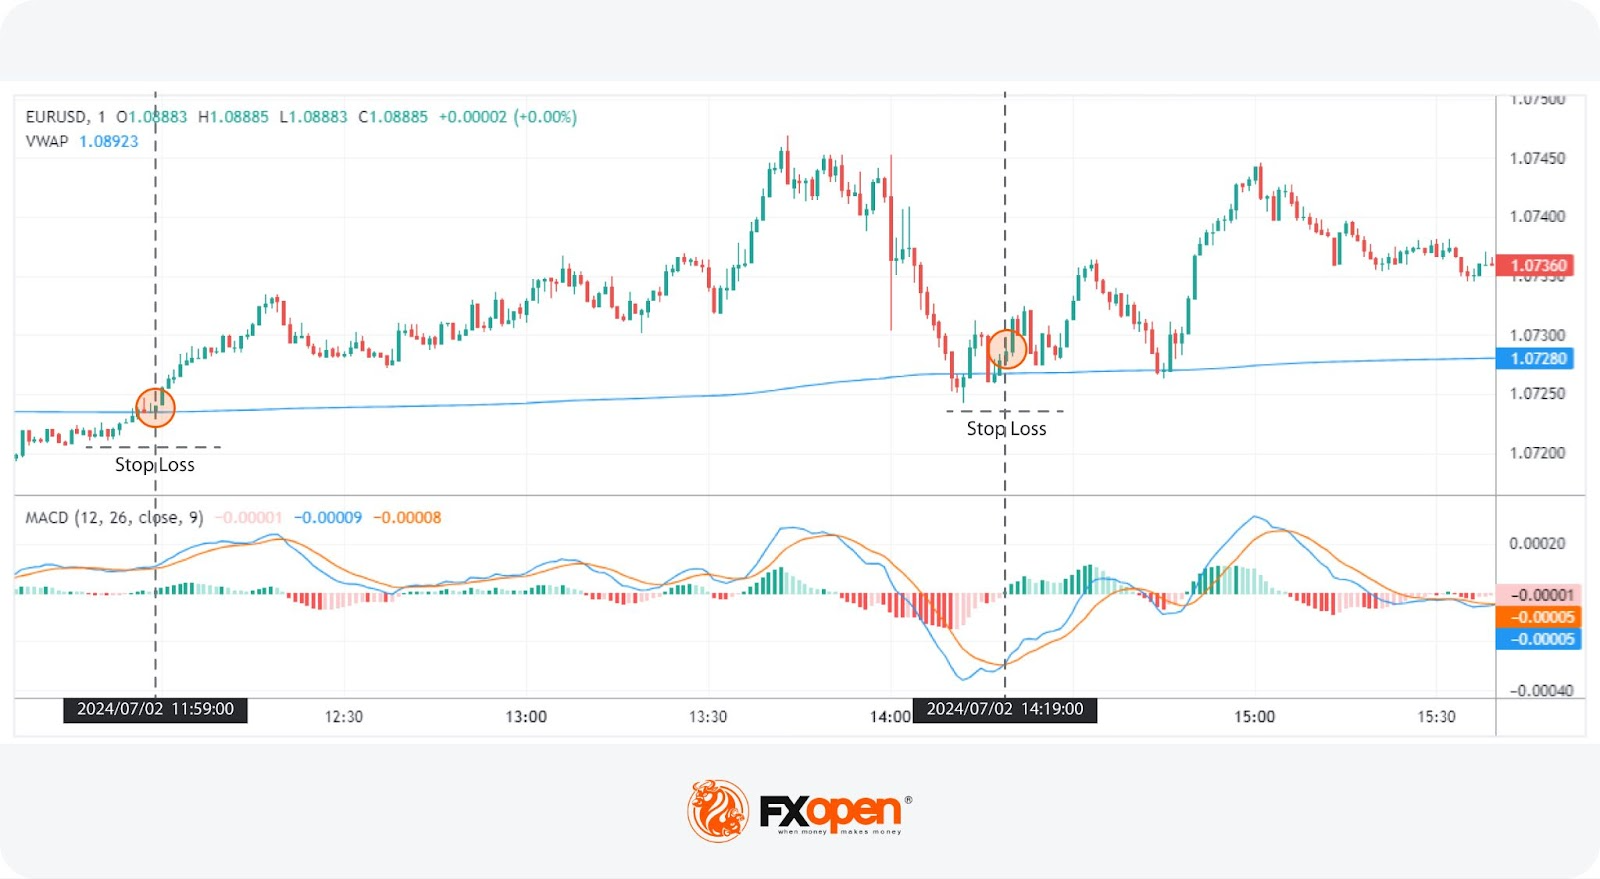
VWAP (Volume Weighted Average Price): VWAP calculates the average price a security has traded at throughout the day, based on both volume and price. It may help traders determine the trend and identify potential support and resistance levels.
MACD (Moving Average Convergence Divergence): MACD is an indicator that visualises the relationship between two moving averages. MACD settings for a 1-minute chart are standard: the MACD line is derived from the difference between the 12-period and 26-period exponential moving averages (EMA), while the signal line is a 9-period EMA of the MACD line.
VWAP and MACD work well together by providing both trend and momentum analysis. VWAP is used to determine the overall trend and significant price levels, while MACD offers insights into momentum changes. This combination may help traders set entries by confirming trends and potential reversals.
Entry
Traders typically look for the price to close through the VWAP, with the MACD turning from positive to negative or vice versa. This coincides with the signal line crossing over the MACD line.
Alternatively, another common entry point is when the price uses the VWAP as a level of support or resistance, confirmed by the MACD turning from positive to negative or vice versa.
These triggers will likely occur within a few candles of each other, typically within 4 or 5 candles.
Stop Loss
Stop losses are often set just beyond a recent high or low swing point, which may help traders potentially protect against losses if the market moves unexpectedly.
Take Profit
Traders commonly take profits when the signal line crosses the MACD line in the opposite direction, and the histogram switches from positive to negative or vice versa. This approach allows traders to take advantage of momentum shifts and potentially lock in gains as the trend changes.
However, some may prefer to exit at a significant support or resistance level in order to maximise potential gains.
Strategy 2: Keltner Channels + RSI
Indicators Used
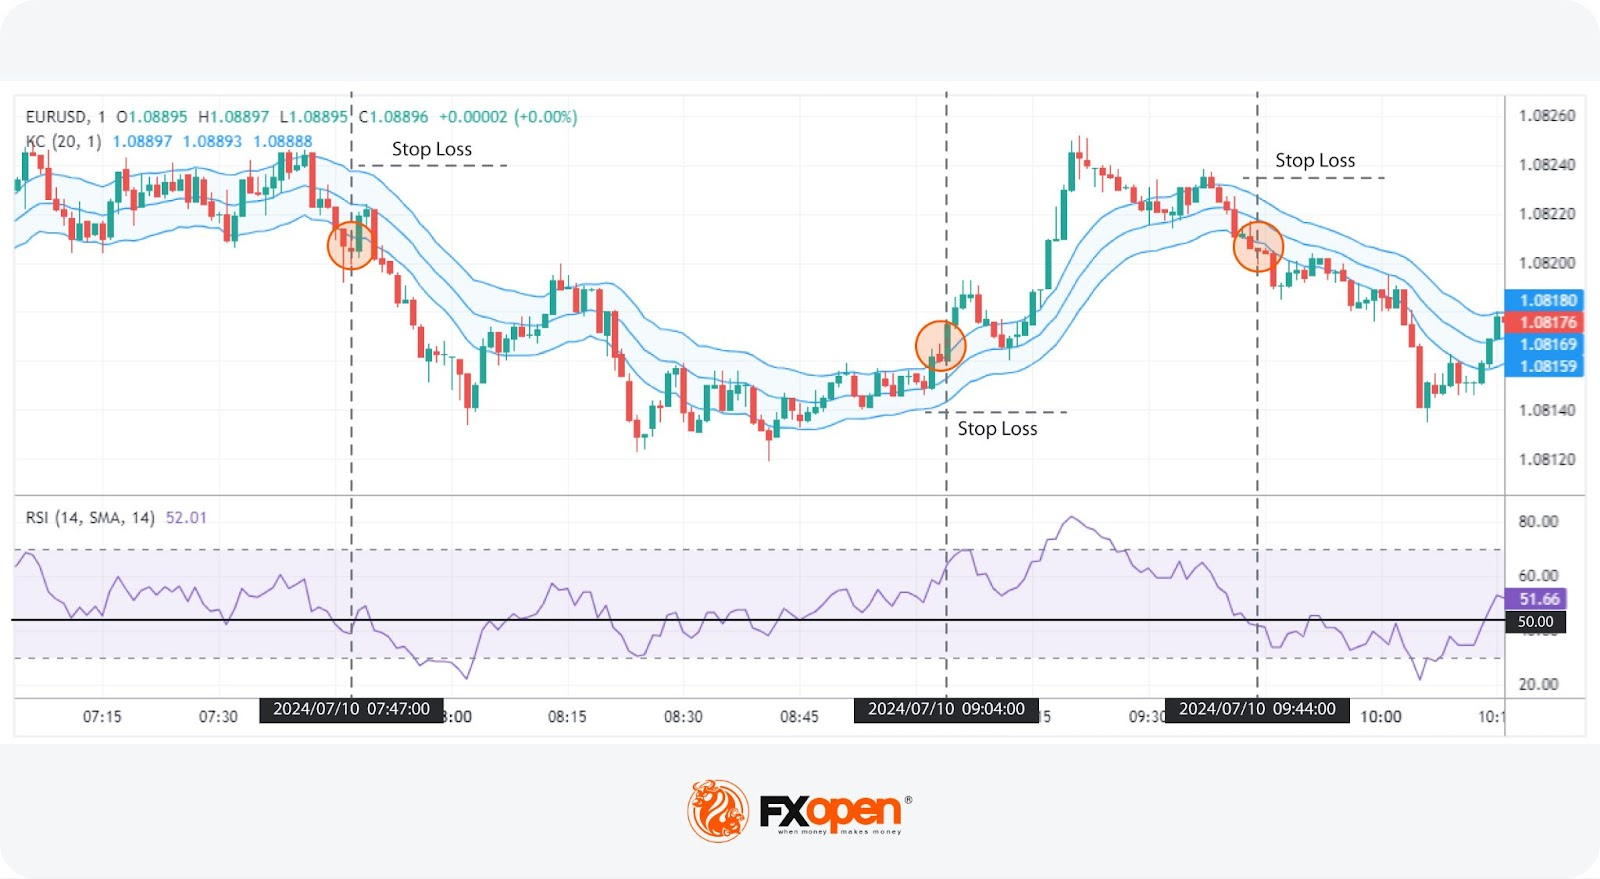
Keltner Channels: A volatility-based envelope set above and below an exponential moving average. The channels are typically set to two average true range (ATR) values away from the EMA. They are used by traders to identify overbought and oversold conditions and potential breakouts.
RSI (Relative Strength Index): A momentum oscillator that gauges the rate and extent of price changes. It ranges between 0 and 100, where readings above 70 signal overbought conditions, and readings below 30 indicate oversold conditions. RSI can also indicate bullishness when it crosses above 50 and vice versa.
The Keltner Channels, which offer insights into breakouts, and the RSI, which gauges momentum, may support traders in finding entry points on the 1-minute chart.
Entry
Traders often look for two or more closes outside of the Keltner Channel and ideally strong and/or consecutive green (bullish) or red (bearish) candles.
This is confirmed by the RSI recently breaking above 50 for bullish signals or below 50 for bearish signals.
The combination of strong price action and momentum change may help traders identify potential trend continuations.
Stop Loss
Stop losses are commonly set beyond the opposite side of the Keltner Channel to potentially protect against adverse price movements.
For a higher risk-reward ratio, traders might place stop losses beyond a nearby swing candle.
Take Profit
Traders typically take profits when the price crosses back beyond the Keltner Channel's midpoint or reaches the opposite side of the channel, indicating a potential exhaustion of the current move.
Alternatively, profits may be taken when RSI moves beyond 70 (overbought) or below 30 (oversold), signalling potential reversals in price direction.
Strategy 3: ALMA + Stochastic
Indicators Used
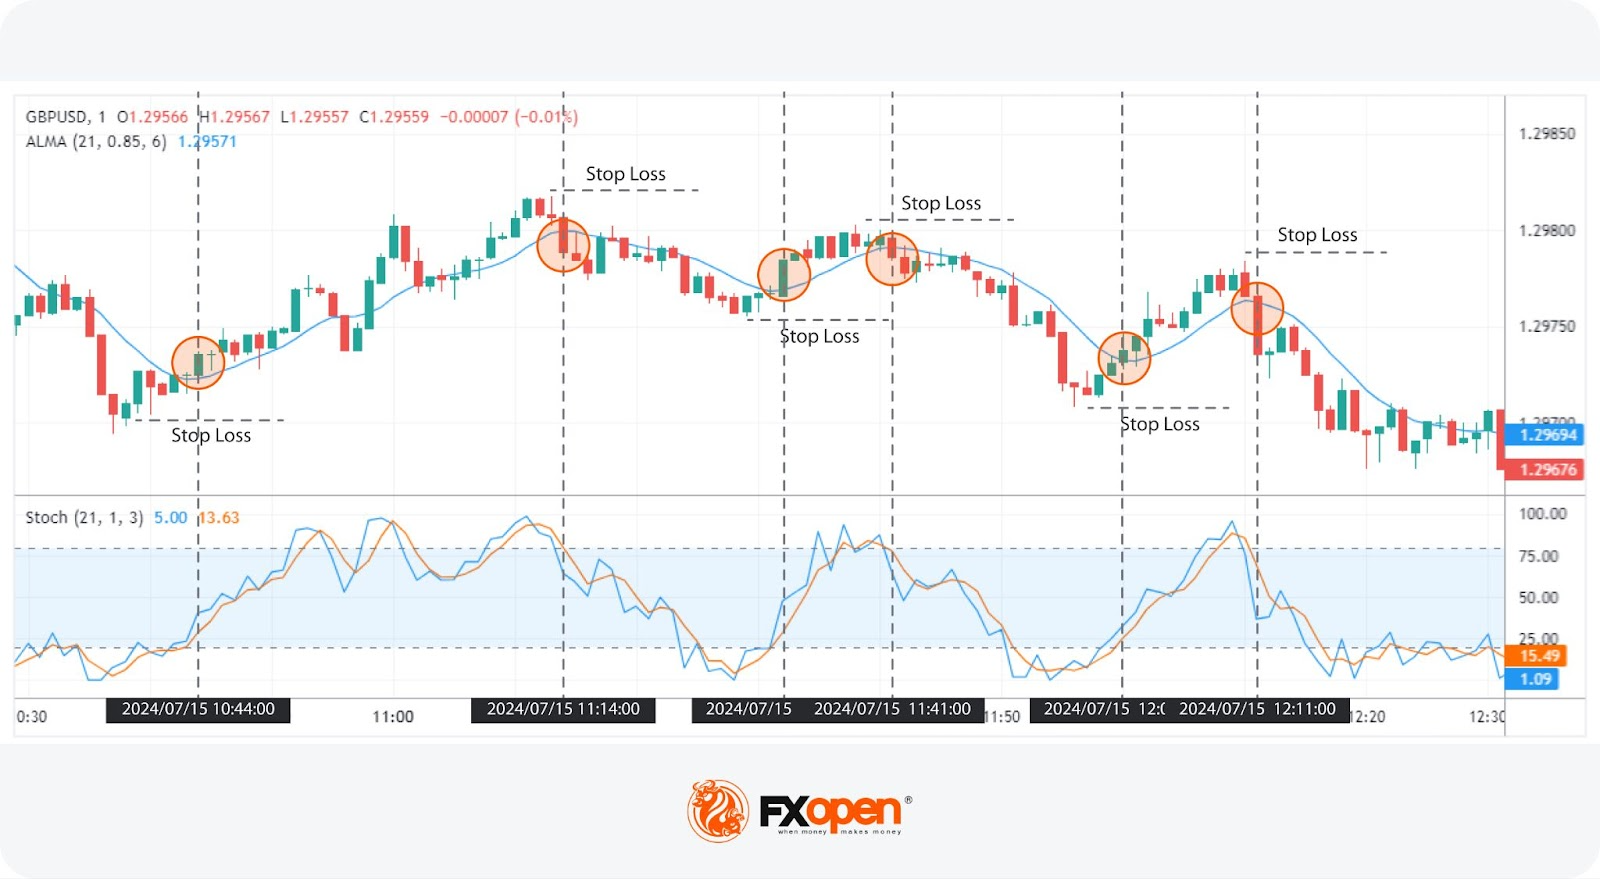
ALMA (Arnaud Legoux Moving Average): ALMA is a moving average that aims to smooth price data while reducing lag. The settings used are 21 for the window size, 0.85 for the offset, and 6 for the sigma. This combination may support traders when identifying the trend.
Stochastic Oscillator: The Stochastic measures the location of the close relative to the high-low range over a set period. Settings of 21, 1, 3 are used to capture momentum and potential reversal points. A figure above 80 signals overbought conditions, while below 20 indicates the opposite.
Combining ALMA with the Stochastic Oscillator allows traders to identify potential reversals in trends. ALMA provides a smoothed view of the price trend, while the Stochastic Oscillator offers momentum-based signals that is expected to help confirm the strength of a move.
Entry
Traders look for the price to close through the ALMA, ideally with a strong close, which suggests a potential trend change.
This is confirmed by the Stochastic Oscillator crossing below 80 for a bearish signal or above 20 for a bullish signal, indicating momentum alignment with the trend.
Note that price may fluctuate above and below the ALMA in ranging conditions and produce false signals.
Stop Loss
Stop losses are typically set beyond the nearest swing point, which might help protect against adverse price movements.
Take Profit
Traders typically take profits when the Stochastic reaches the opposite territory (e.g., from above 80 to below 20 for a bearish move), indicating a potential exhaustion of the current trend.
Alternatively, profits may be taken at identified areas of support or resistance, where price action historically reacts, providing a logical exit point.
Strategy 4: RSI + Bollinger Bands
Indicators Used
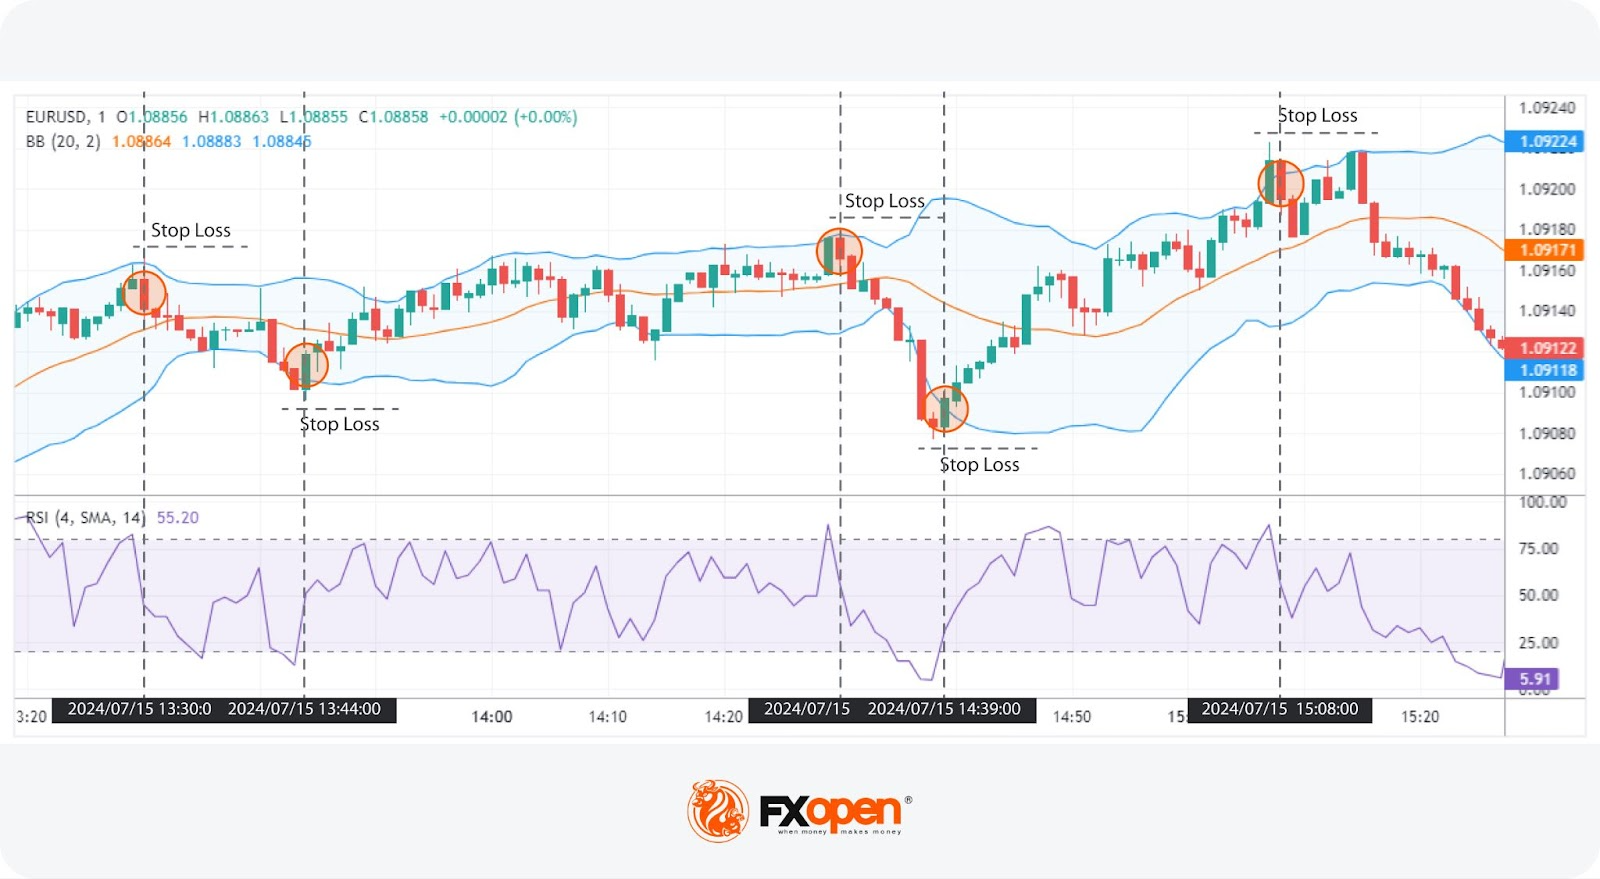
RSI (Relative Strength Index): For this strategy, RSI settings in a 1-minute chart are a length of 4, with overbought and oversold boundaries at 80 and 20, respectively. These settings are popular when identifying short-term overbought and oversold conditions.
Bollinger Bands: Bollinger Bands settings for a 1-minute chart are a 20-period simple moving average (middle band) and two outer bands set at a standard deviation level of 2 from the middle band. They may help determine periods of high and low volatility as well as potential reversal points.
The combination of RSI and Bollinger Bands allows traders to identify potential short-term reversals in the market. Bollinger Bands provide a dynamic range for price action, while the RSI confirms overbought or oversold conditions. This may support traders when identifying entry and exit points.
Entry
Traders often enter when the RSI crosses below 80 from above or above 20 from below, signalling an exit from potential overbought or oversold conditions.
This entry is confirmed when the price is also touching or breaching the Bollinger Band, indicating the likelihood of a short-term reversal.
Stop Loss
Stop losses are typically set beyond a nearby swing point or just outside the Bollinger Band, providing potential protection against significant adverse price movements and giving the trade room to develop.
Take Profit
Traders commonly take profits when the price touches the opposing Bollinger Band, suggesting a potential end to the current price move.
Alternatively, some may take profits when the RSI crosses into the opposing overbought or oversold territory, indicating a shift in momentum.
The Bottom Line
Mastering 1-minute scalping strategies requires a combination of speed, precision, and disciplined risk management. The usefulness of a trading strategy may depend on several factors, including a thorough understanding of technical indicators, adherence to strict trading rules, and the ability to adapt to changing market conditions in real time.
If you want to develop your own trading approach and learn market behaviour in different conditions, you may consider opening an FXOpen account. FXOpen provides access to over 700 markets, with commissions starting from just $1.50 and spreads from 0.0 pips.
FAQ
What Is the 1-Minute Timeframe Trading Strategy?
The 1-minute timeframe trading strategy involves making multiple trades within a single minute, aiming to capture small price movements. Traders use a 1-min scalping strategy when they rely heavily on technical indicators and prefer to act immediately.
Which Indicator Is Popular for 1-Minute Scalping?
There is no single 1-minute scalping strategy indicator; it comes down to preference and experience. However, popular choices include the Moving Average Convergence Divergence (MACD), Relative Strength Index (RSI), Bollinger Bands, and the Volume Weighted Average Price (VWAP). Many traders combine several indicators to enhance signals.
What Is the Popular Timeframe for Scalping Crypto*?
The timeframe for crypto* scalping depends on the trader's preference and strategy. While a 1-minute crypto* scalping strategy is based on numerous rapid trades, some traders prefer slightly longer timeframes like the 5-minute or 15-minute charts to balance speed and cryptocurrency* market noise.
What Is the Stochastic Setting for 1-Minute Scalping?
For 1-minute scalping, the Stochastic Oscillator is typically set to the standard settings of 14, 1, 3. These settings may help capture short-term momentum changes, providing timely signals for entry and exit points. Adjustments can be made based on the trader's specific strategy and market conditions.
*Important: At FXOpen UK, Cryptocurrency trading via CFDs is only available to our Professional clients. They are not available for trading by Retail clients. To find out more information about how this may affect you, please get in touch with our team.
About Author
Lorem ipsum dolor sit amet, consectetur adipiscing elit. Nunc fermentum lectus eget interdum varius. Curabitur ut nibh vel velit cursus molestie. Cras sed sagittis erat. Nullam id ante hendrerit, lobortis justo ac, fermentum neque. Mauris egestas maximus tortor. Nunc non neque a quam sollicitudin facilisis. Maecenas posuere turpis arcu, vel tempor ipsum tincidunt ut.