
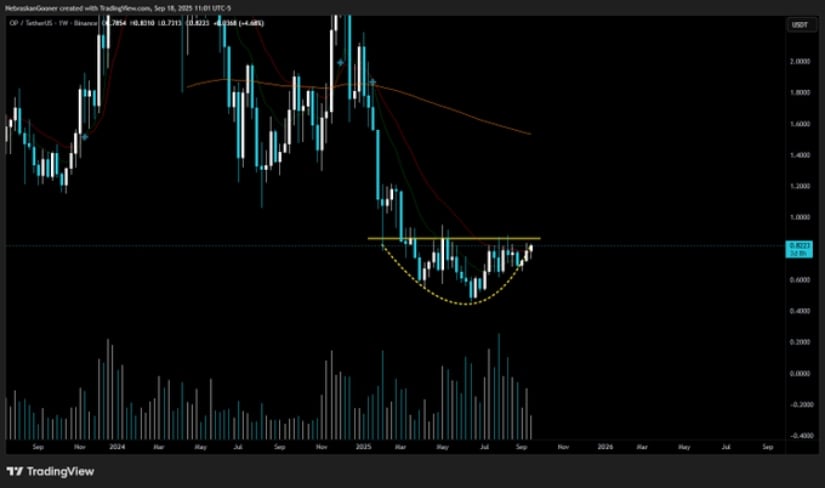
After months of steady recovery from earlier lows, the token has formed a rounded bottom pattern — a classic bullish reversal signal. Price action is now pressing against resistance near $0.82–$0.85, a zone that has capped rallies in recent weeks. A decisive close above this neckline could trigger a trend shift and open room for a sustained rally.
The weekly chart shows OP curving higher from its April 2025 lows, establishing a rounded base after a long decline. This structure reflects how sellers have gradually lost strength while buyers step in at higher levels, creating a foundation for accumulation. Each retest of resistance has been met with renewed volume, highlighting growing interest as the breakout level comes into play.
Source: X
Volume analysis adds credibility to the bullish setup. Unlike the steep sell-offs earlier in the year, recent rallies have been supported by stronger trading activity, signaling healthier demand. If momentum holds, this accumulation phase could evolve into a breakout push above $0.85, where the rounded bottom would confirm its reversal potential.
Still, challenges remain. Overhead moving averages, particularly the 50-week and 200-week, are positioned above current price levels and may serve as additional hurdles once the neckline is broken. Failure to breach resistance could extend consolidation, with downside risks toward $0.65–$0.70. For now, the crypto sits at a critical inflection point, with the rounded bottom pattern setting the stage for either confirmation or rejection in the coming weeks.
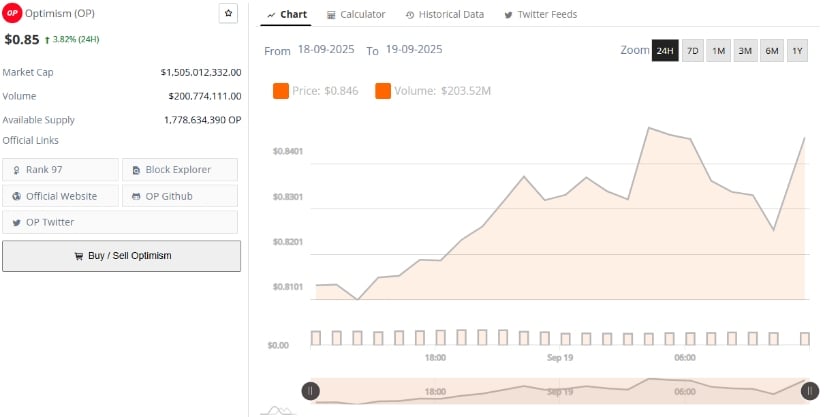
Additionally, the token is trading near $0.85. This rise comes as daily trading volumes climb above $200 million, reflecting steady participation from both retail and institutional traders. The consistent inflows indicate a market that is gradually leaning bullish, particularly as the asset consolidates around its near-term resistance.
Source: BraveNewCoin
At the same time, the asset’s $1.50 billion market cap places it firmly among top-performing mid-cap tokens, where liquidity depth can drive sharper directional moves. Holding above $0.81 support remains crucial, as a breakout beyond $0.85 could clear the path toward psychological targets near $1.00.
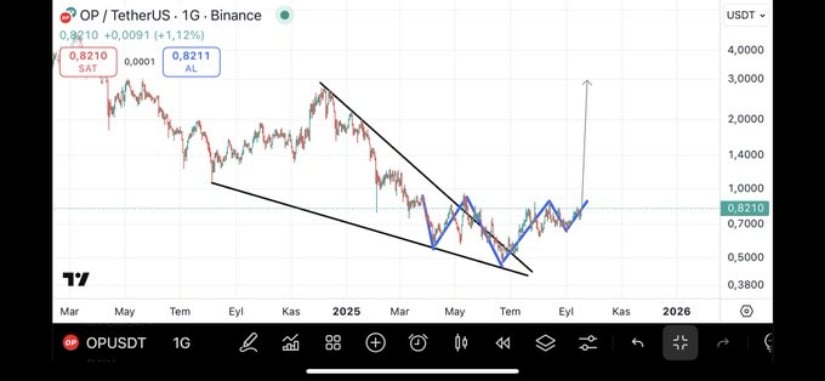
At press time, Optimism was trading near $0.821, breaking out of a descending wedge formation that had capped its price action throughout 2024. The shift signals a potential trend reversal, with higher lows and higher highs beginning to take shape.
Source: X
The chart also reveals an inverse head and shoulders structure around the $0.80 zone, a classic bullish indicator. Its completion suggests momentum is tilting in favor of buyers, strengthening the case for further upside.
Combined with the wedge breakout, these patterns highlight the asset’s potential for a sustained rally. If the current trajectory holds, traders could see a sharper push higher, with the setup hinting at significant gains ahead.


