
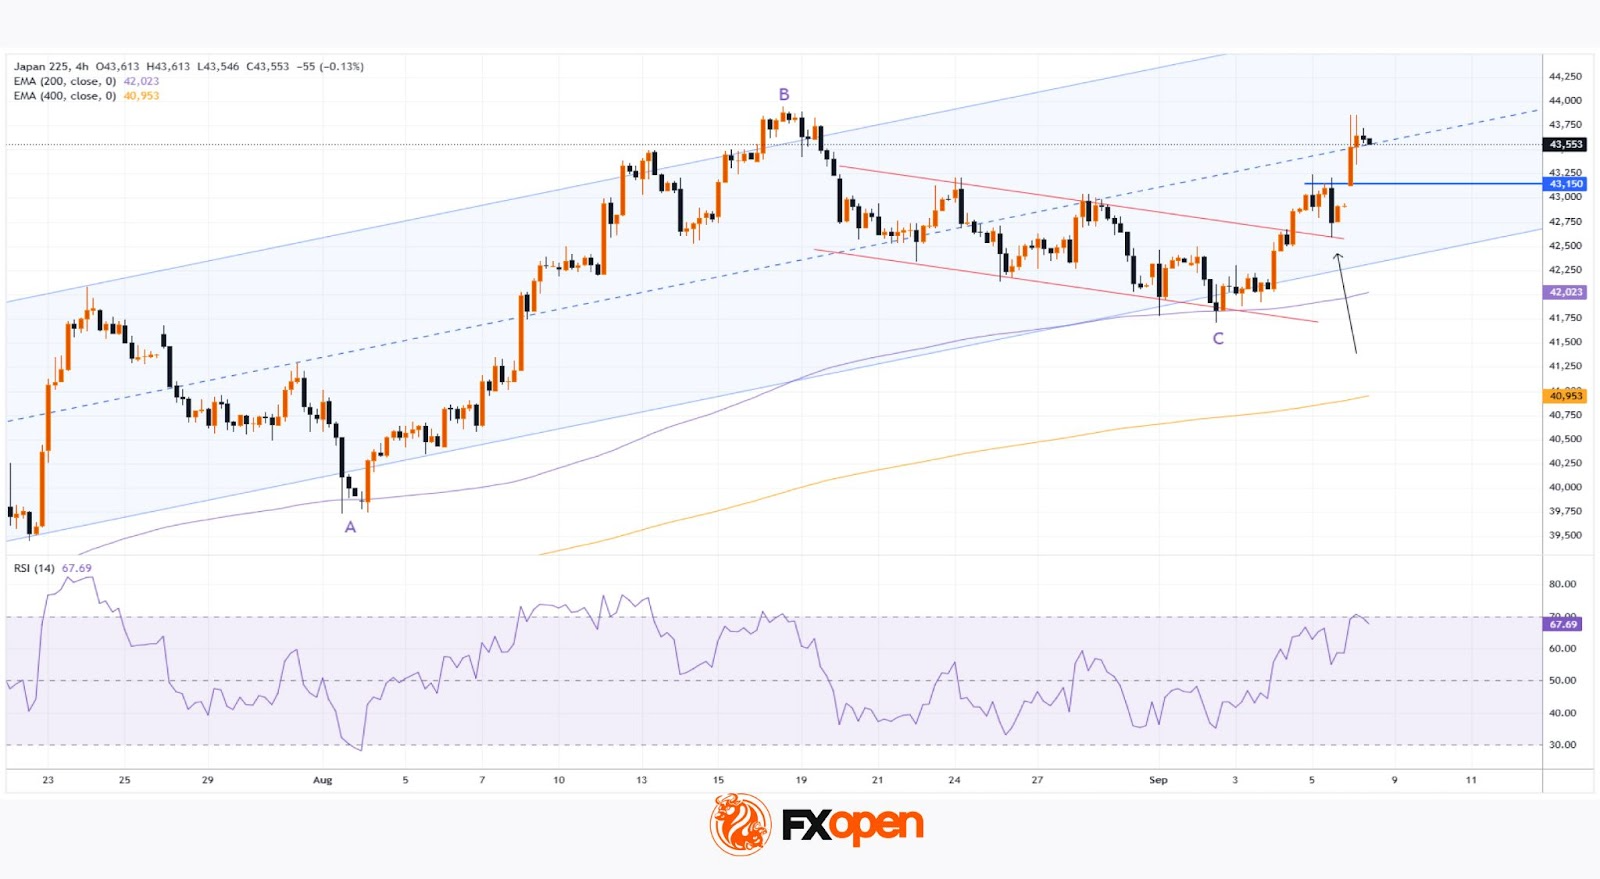
As the chart shows, Japan’s Nikkei 225 stock index (Japan 225 on FXOpen) today approached its historic peak (B) around the 43,900 level.
Bullish sentiment was driven by political news. According to Reuters, Prime Minister Shigeru Ishiba has stepped down. The leading candidate to replace him, Sanae Takaichi, is regarded as a supporter of stimulus measures and unprecedented monetary easing – a bullish factor for companies.
Technical Analysis of the Nikkei 225
As indicated by the 200- and 400-period moving averages on the 4-hour chart, Japan’s stock market remains in a long-term uptrend. This summer, index movements have been forming an ascending channel, highlighted in blue, with the lower boundary acting as strong support.
Other bullish signs include:
→ A bullish structure, highlighted by a normal pullback of around 50% (B→C) following the A→B impulse.
→ During the B→C decline, price movements formed a corridor (marked with red lines) resembling a bullish flag pattern. Its breakout suggests an attempt to resume the upward trend after an interim correction.
→ Recent price action, indicating that former resistance levels have turned into support. This applies both to the upper red line (marked with an arrow) and to last week’s former resistance at 43,150.
On the other hand:
→ Long upper shadows on today’s candles point to increased selling pressure near the historic peak.
→ The RSI indicator has risen to the overbought territory.
Given that the index is now around the median of the ascending channel (a level where supply and demand tend to balance), we could assume the market may consolidate in the short term. Possible scenarios include:
→ Attempts to break through the historic high, which may fail – potentially trapping overly optimistic participants and creating signs of a bearish ICT Liquidity Sweep pattern above peak B.
→ A correction with a retest of the 43,150 level.


