
As the US Dollar Index (DXY) chart shows, the value of the USD against a basket of other currencies has fallen below 97.30 – its lowest level since late July.
The reasons lie in market sentiment ahead of major data releases:
→ On Wednesday at 15:30 GMT+3, Producer Price Index (PPI) figures will be published; a month ago they came in extremely high.
→ On Thursday at 15:30 GMT+3, Consumer Price Index (CPI) figures are due.
These releases are particularly significant as next week the Federal Reserve is set to announce its decision on interest rates – a 25-basis-point cut is widely expected.
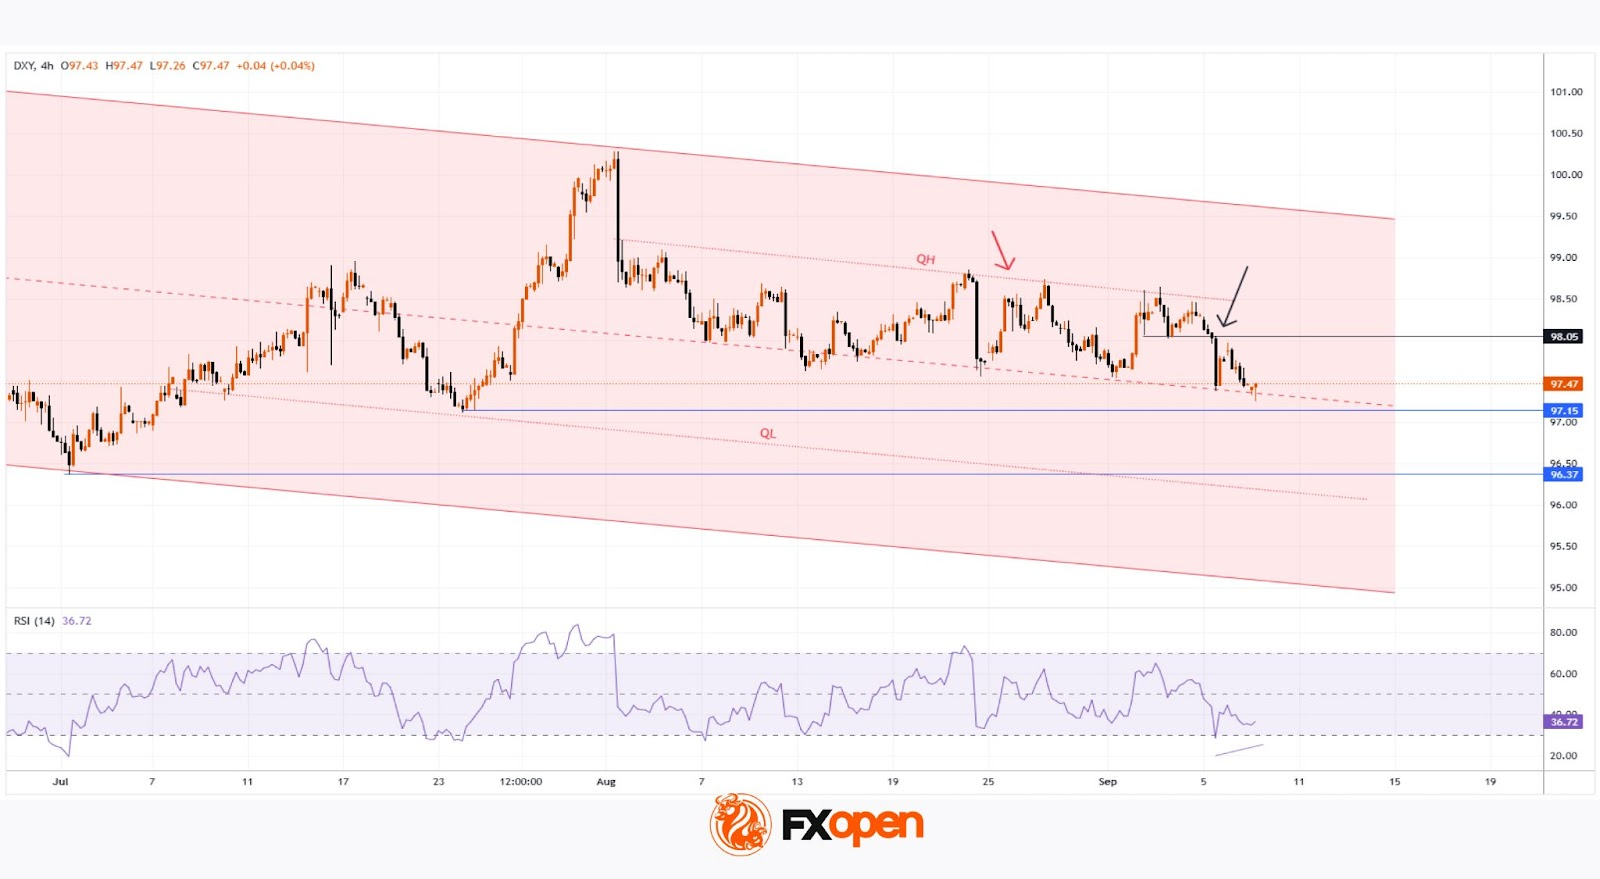
Technical Analysis of the DXY Chart
On 18 August, we identified a descending channel (shown in red) based on a sequence of lower highs and lower lows → it remains valid.
In addition, our base scenario suggested that the index might test one of the quartile lines (QL and/or QH) dividing the channel → indeed, since then the QH line has been tested several times (red arrow), convincingly acting as resistance.
What Next?
Bearish case:
→ Lower highs and lows throughout the second half of August indicate that sellers are in control of the DXY market.
→ The black arrow marks bearish momentum that broke through support at 98.05 last week.
→ The drop was sharp (a sign of imbalance in favour of sellers), and yesterday the 98.05 level acted as resistance.
Bullish case:
→ The DXY has dropped into the median zone, where supply and demand often balance. Buyers may step in, viewing current levels as attractive for entry.
→ The RSI may potentially form a bullish divergence.
→ The latest candle on the right shows a long lower wick (a bullish pin bar pattern), underlining buyers’ determination.
Given the above, we could expect the DXY to hover around the median area. However, the upcoming US inflation reports could trigger volatility across financial markets. A test of support at 97.15 could occur.


