
Binance Coin (BNB) continued to trade within a tight range near resistance levels on April 8. Price action reflected hesitation as buyers failed to extend gains. Market structure remained fragile, with short-term direction still unclear across the broader trend.
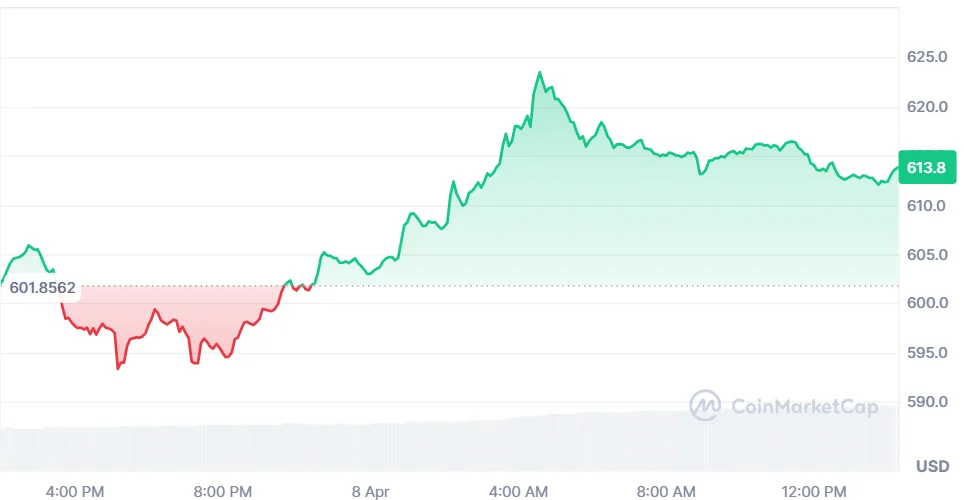
As of writing, Binance Coin (BNB) is trading at $613.83 on Wednesday, April 8, recording a 1.58% daily gain, according to CoinMarketCap. Trading activity increased sharply during the session. The trading volume rose 49.09% to $2.21 billion, while the token posted a slight weekly decline of 0.12%.
Also Read: Binance Coin (BNB) Price Struggles Below $600 as Sellers Maintain Control
Crypto analyst Marcus Corvinus highlighted that BNB has lost its rising structure. He noted that the asset is now showing weakness in its current range.
Price remains stuck between $590 and $610 after bouncing from $572 support. However, it still trades below its prior structure, which signals limited strength.
Further, the analyst added that follow-through on the bullish side continues to be weak. Momentum indicators signal fading buying momentum.
Failure to support this area could leave open chances for declines. In case the price does not manage to support itself here, the near-term outlook may remain bearish with $572-$580 attracting sellers.
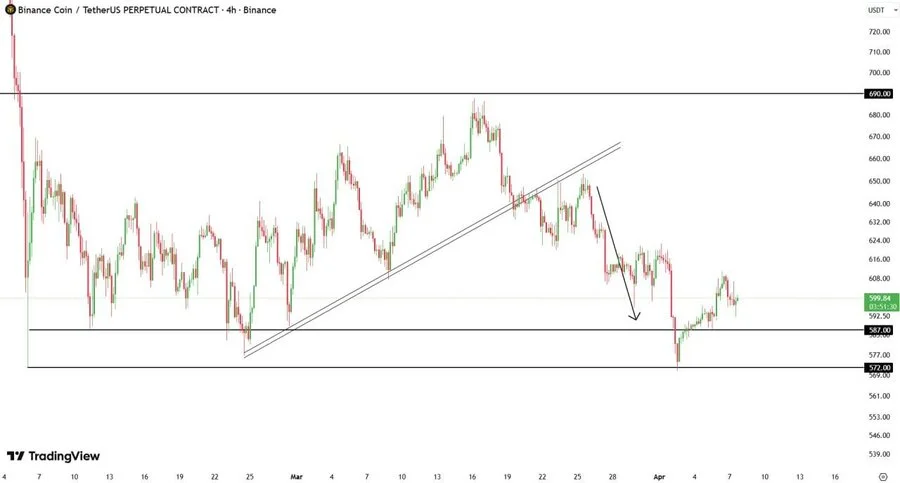
From the upside, there is one significant range to consider. Breakout above $615-$620 could transform the technical picture to a bullish scenario. This could provide hope and help aim for higher targets. In the meantime, the current trend shows indecision rather than strength.
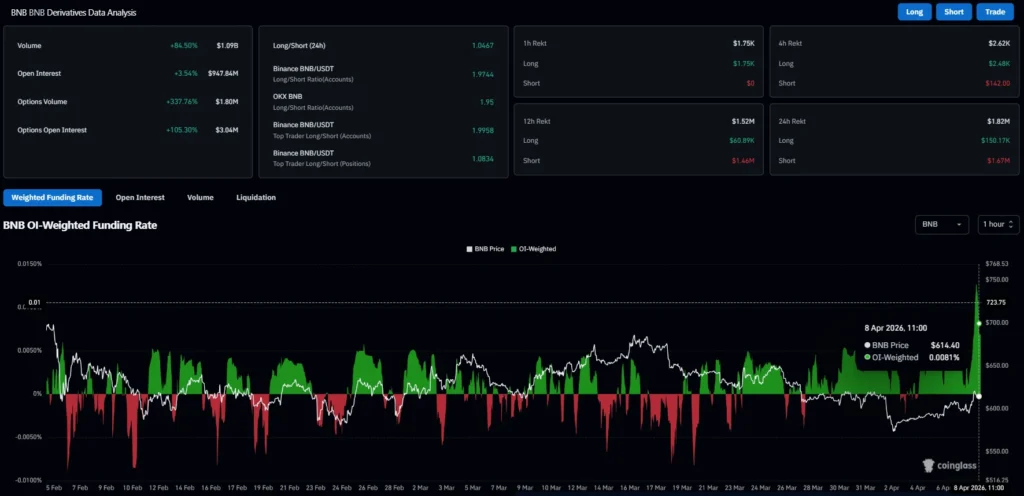
According to CoinGlass data, the futures volume rose by 84.50% to $1.09 billion. However, open interest increased by 3.54% to $947.84 million. The OI-weighted funding rate is recorded at 0.0081%, indicating a slightly positive positioning.
The technical indicators show that the BNB is trading below the short-term averages. The 20-day EMA is currently at $615.34, slightly above the price of BNB. The 50-day EMA is standing at $642.89, providing an upper resistance.
The longer averages are still above the price level of BNB, indicating bearish pressure. The 100-day EMA is at $700.93, and the 200-day EMA sits at $759.68. This suggests that the price would need to go above these averages to be considered bullish.
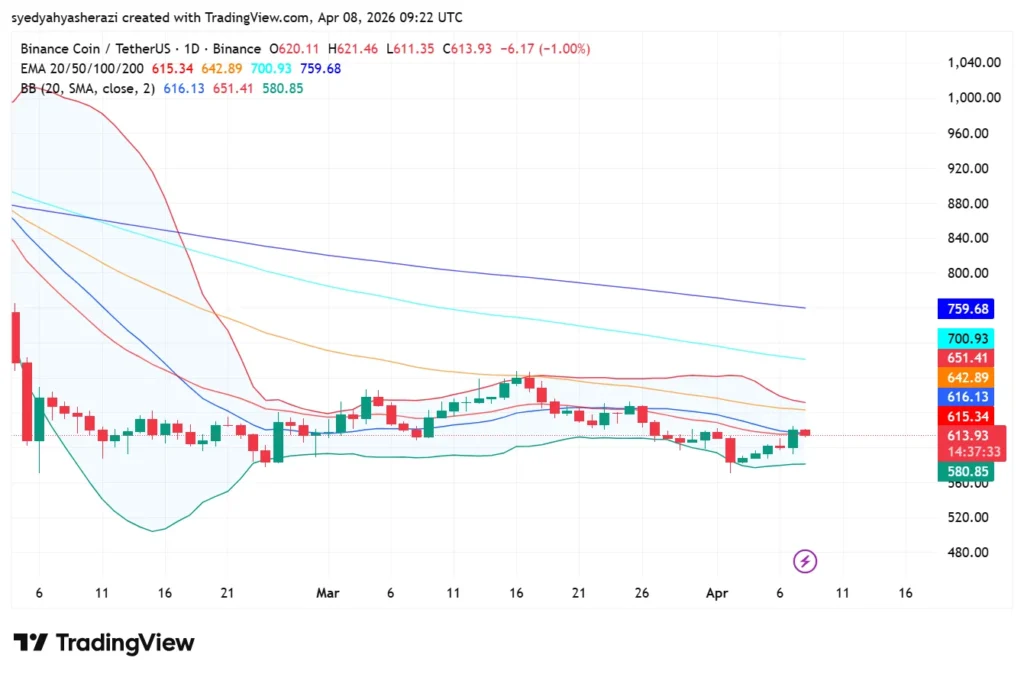
As per the Bollinger bands, there is a tight trading range in the market. The upper Bollinger band (BB) is currently at $651.41, with the middle BB being at $616.13. Meanwhile, the lower BB is located at $580.85. Price remains close to the mid-to-lower band area, suggesting consolidation.
This article contains market analysis and price predictions. These are not guarantees. Crypto markets are volatile. Always DYOR. Not financial advice.
Also Read: Zcash (ZEC) Bullish Setup Points to Potential Breakout Toward $750

