
XRP is currently the only major asset attracting fresh capital, highlighting a shift in investor focus, as of 8 April 2026.
While broader crypto sentiment remains uncertain, XRP shows relative strength as traders rotate funds toward assets displaying resilience and short-term upside potential.
Meanwhile, Bitcoin, Ethereum, and Solana spot ETFs reported significant outflows, losing $159M, $64.7M, and $15.4M, respectively.
In contrast, XRP recorded a $3.32M net inflow, signaling selective accumulation as investors reposition capital away from larger, slower-moving assets.
Also Read: XRP Traders Down 41% on Average, Lowest Since 2022 Crash
The XRP daily chart shows a shift from a strong uptrend into a bearish structure after peaking near $2.20. Price began forming consistent lower highs and lower lows, confirming trend weakness.
A sharp February breakdown accelerated selling pressure and changed overall market sentiment significantly.
Key levels define the current structure clearly. Resistance stands around $1.80–$1.90, with another barrier near $1.55–$1.60, where the price faced rejection.
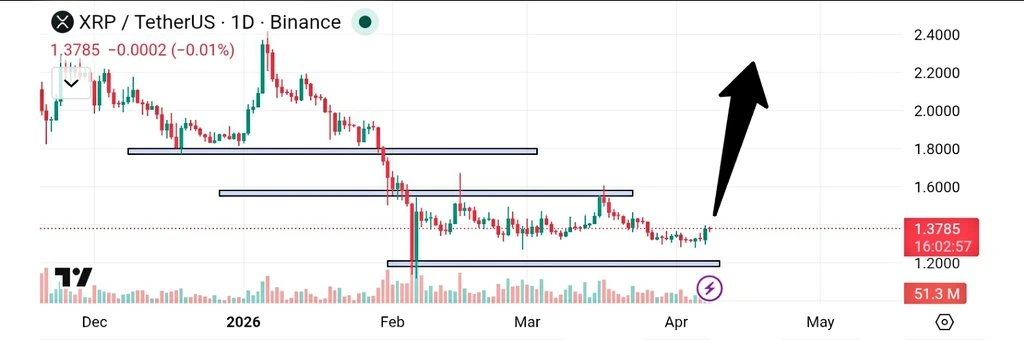
Strong support sits between $1.20–$1.25, repeatedly holding declines. This range highlights a consolidation phase as buyers and sellers struggle to establish directional control.
Current price action has exhibited some consolidation with low volume, indicating a period of rest following an extended period of selling. The buyers are defending the support level, but there is still limited strength in the bulls.
As mentioned by crypto analyst ALTS GEMS Alert, a break above the $1.60 level will trigger a bullish move towards $2.20, while a breakout below $1.20 will invite more pressure on the downside.
There is a suggestion of new momentum developing in the Momentum indicators. RSI has touched the mark of 51.90 with the moving average at 41.70; this shows the development of momentum as we come out of the last phase of consolidation.
After making an upward movement from low levels, it continues above the midline. This is a mild indication of bullish momentum developing.
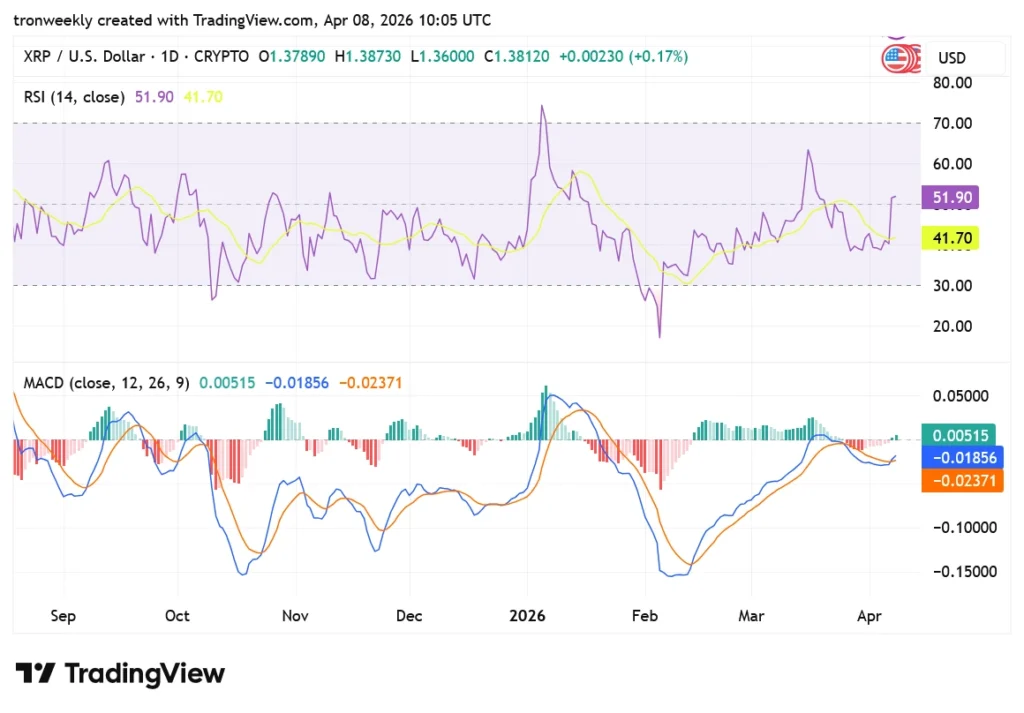
MACD implies that there could be a reversal towards bullishness soon because of the positive histogram value, which stands at 0.00515.
MACD is at -0.01856, nearing the signal level of -0.02371. This narrowing indicates decreasing bearishness as buyers slowly take control of the market.
This article contains market analysis and price predictions. These are not guarantees. Crypto markets are volatile. Always DYOR. Not financial advice.
Also Read: XRP Liquidity Collapses as Market Awaits Key Catalyst

