BTC, ETH, SOL, SUI, and TAO -what the numbers actually say, and where I’m probably wrong.
I’ve been doing this long enough to know that year-end price targets are mostly fiction. But that’s not the same as saying forecasting is useless. The point isn’t to nail a number. It’s to understand the distribution of outcomes well enough to size positions without getting wiped out by the scenario you didn’t price in.
So here’s my current view. Probability-weighted, macro-anchored, and honestly graded against where I was six months ago.
Let me start with the part everyone keeps getting wrong: oil.
Brent peaked at $138 on April 7th when the Strait of Hormuz situation looked like it could go full catastrophe. It’s come down to around $103.50 now on ceasefire progress between the US and Iran. That’s the good news.
The bad news is that $103 oil is still elevated. April CPI came in at 3.8% year-over-year, the highest reading since May 2023. The energy component was up 17.9%, gasoline up 28.4%. The Fed is frozen at 3.50–3.75%, markets are pricing roughly 40% odds of a December hike, and the 10-year yield is sitting near a one-year high at 4.58%.
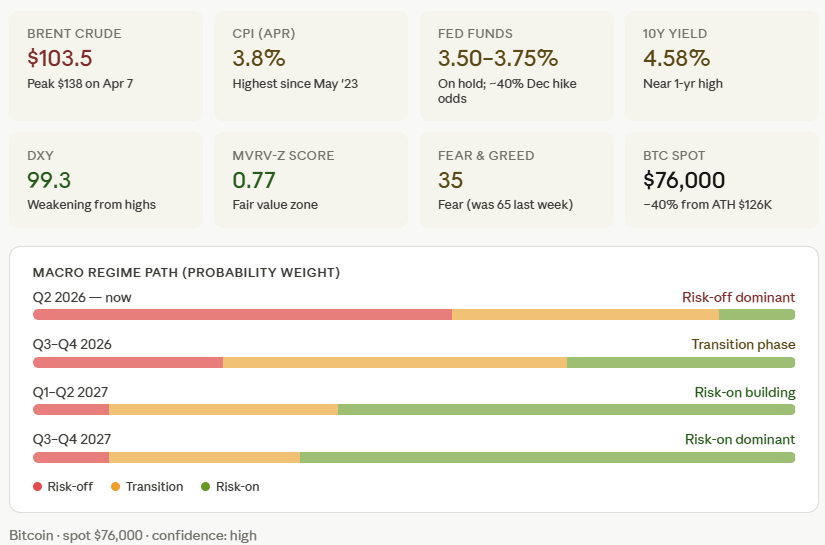
Here’s the thing people keep misunderstanding about where we are: this isn’t deteriorating, it’s transitioning. There’s a difference. The ceasefire has held since April 8th. The Hormuz situation hasn’t collapsed. But it’s also one Tehran statement away from re-engagement. That’s not a clean bull thesis. It’s just less bad than it was.
Bitcoin is sitting at around $76,000, about 40% below its October 2025 all-time high of $126,173. MVRV-Z is at 0.77, which is fair value territory. Fear and Greed just dropped from 65 to 35 in a week. That kind of fear compression is usually the setup for the next leg, not the confirmation of a new bottom.
My core thesis going into 2026 was this: oil leads inflation, inflation drives Fed hawkishness, hawkishness contracts liquidity, and BTC gets sold when margin calls hit equity desks. That chain played out almost exactly.
April CPI came in at 3.8% versus my rough forecast of 3.7%. The Fed stayed on hold with growing hike risk. BTC is down roughly 40% from ATH. Brent’s $138 peak briefly validated the worst-case Hormuz scenario.
But I got a few things wrong.
I treated Hormuz as a binary switch: either open or closed. Reality was more graduated. Ceasefire, partial reopening, reduced capacity but not zero. Less extreme outcome than the framework implied.
I also underweighted how quickly corporate treasury Bitcoin demand could reverse. There was roughly an 80% month-over-month drop in corporate BTC buying in April. The institutional bid is more fickle than the 2024–2025 narrative made it seem.
So: mostly right on the macro chain, partially wrong on the severity, and wrong on institutional durability. I’m updating accordingly.
Spot is at $76,000. Here’s how I’m thinking about the distribution from here.
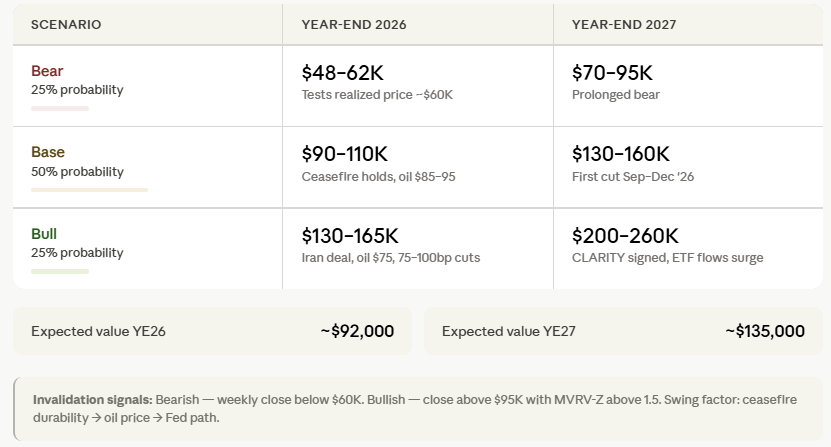
The base case, which I’m giving 50% probability, is $90,000–$110,000 by year-end 2026, and $130,000–$160,000 by year-end 2027. What does that require? The ceasefire holds, oil drifts to $85–95, CPI rolls over in Q4, and the Fed cuts once between September and December. Plus CLARITY passes and ETF flows turn positive again.
That’s a lot of conditions. But none of them are unreasonable.
The bear case, at 25%, is $48,000–$62,000 by year-end. That requires the ceasefire to collapse, oil to re-spike above $130, and the Fed to actually hike in December. BTC would test the realized price around $60,000 in that scenario. That’s not a fun trade.
The bull case, also at 25%, is $130,000–$165,000 by year-end. That’s an Iran deal, oil back to $75, 75–100 basis points of cuts, and CLARITY signed before midterms. Possible, but it requires a lot to go right quickly.
The probability-weighted expected value for BTC at year-end 2026 is around $92,000. For year-end 2027, about $135,000.
Two clean invalidation levels to watch: a weekly close below $60,000 is bearish confirmation. A close above $95,000 with MVRV-Z reclaiming 1.5 is the bull signal. Everything in between is just noise.
I’ve written before about concentrating in BTC during panic, then rotating to higher-beta altcoins during recovery. That sequencing still applies. Here’s where I’d rotate, in order.

ETH is medium conviction for me. The Glamsterdam upgrade is a binary event. If it ships cleanly, ETH probably recovers toward $2,800–$3,600 by year-end. If it disappoints, L2 cannibalization continues chewing into the base-layer thesis. The ETH/BTC ratio is the tell: bearish if it breaks below 0.025 for 30 days, bullish if it reclaims 0.040.
SOL is also medium conviction. ETF flows are live and compounding, which gives it a structural floor it didn’t have in prior cycles. The Firedancer upgrade shipping date matters a lot for the premium narrative. I’d want to see ETF AUM cross $5B before getting more aggressive.
TAO is my highest-conviction altcoin long, but also my lowest-confidence forecast. The post-halving supply tightening is real. If subnet revenue can scale from $43M quarterly to $200M-plus annualized, and the Grayscale ETF gets approved, this is a $320–$480 asset by year-end 2026. But the exit risk from subnet operators is real, and thin liquidity means the range of outcomes is enormous. The probability-weighted EV is $340 by year-end, but I hold that number loosely.
SUI is lowest confidence. Monthly unlock dilution of roughly 44 million tokens is a constant headwind. The base case requires institutional staking absorption to outpace vesting releases. I’d want to see exchange balances dropping before sizing up meaningfully.
This is probably the most actionable section.

Three events I think matter most, in order:
First, the US-Iran ceasefire and Brent. Every $10 per barrel in oil translates to roughly 30–50 basis points of headline CPI within 60 days. That’s the direct transmission to Fed policy. Everything else is downstream of this.
Second, CLARITY Act passage and the November midterms. This is the biggest pending regulatory catalyst in crypto. If CLARITY passes before midterms with DeFi-friendly language, it re-rates every altcoin meaningfully. If it stalls or comes out hostile, that’s a ceiling on institutional adoption narratives.
Third, BTC’s MVRV-Z score and the realized price. MVRV-Z at 0.77 is fair value but not oversold. The realized price, around $60,000, is the true floor test. A weekly close below that means the analog bottom is later than historical cycles suggest. MVRV-Z reclaiming 1.5 is the recovery confirmation.
The June FOMC and the May CPI print, both in the next few weeks, are the near-term pivots. June 11th CPI and June 16–17th FOMC decision. Those two data points will tell us whether the transition phase I’m describing is on track or getting pushed out.
Bullish flips: A comprehensive Iran deal that sends Brent below $80 by end of Q3. May or June CPI coming in at 3.4% or below. The Fed signaling July or September cuts. BTC ETFs returning to positive 30-day flow above $3 billion.
Bearish flips: Hormuz re-closes. Brent spikes back above $130. The Fed hikes in December. BTC loses $60,000 on a weekly close. A major exchange or stablecoin failure.
I want to be clear about the confidence level here. The YE26 standard deviation for the major assets is roughly plus or minus 35–50%. For SUI and TAO it’s 60–80%. These aren’t point predictions. They’re midpoints inside wide cones. Don’t trade them like they’re precise.
The 4-year halving cycle is real. But it’s being muted by ETF structure and institutional participation. I’m weighting cycle analogs at maybe 60% for the YE27 view, not 90% like I would have in prior cycles. The analog window for a BTC cycle bottom opens in October 2026, roughly 12 months post-ATH. That’s a signal to watch, not a guarantee.
The cycle says we recover. The macro says the path is bumpier than before. Both can be true at the same time.
What are you watching most closely heading into June? The CPI print, the FOMC, or something I’m not tracking? Let me know in the comments.
Not financial advice. Do your own research. I hold BTC and have positions in some of the assets mentioned. This is my analytical framework, not a recommendation.
My Probability-Weighted Crypto Forecast for the Rest of 2026 and Into 2027 was originally published in Coinmonks on Medium, where people are continuing the conversation by highlighting and responding to this story.





