
Capital inflows into spot Bitcoin ETFs reached $986.9 million in the week ending 5 September 2026. Over the past three weeks, cumulative inflows have totalled $3.8 billion, marking the strongest three-week performance for these funds in 2026. Over the same period, spot Ethereum ETFs attracted $218.4 million, down from $824.4 million the previous week, representing a roughly 74% decline in inflows.
Against this backdrop, Ethereum continues to prepare for the Gl Amsterdam upgrade, which is expected to launch on the mainnet in Q4 2026, although an exact date has yet to be confirmed. The upgrade is aimed at further scaling the network and improving the efficiency of transaction and data processing. These factors provide the fundamental backdrop for ETH following its strong rally in the second half of August.
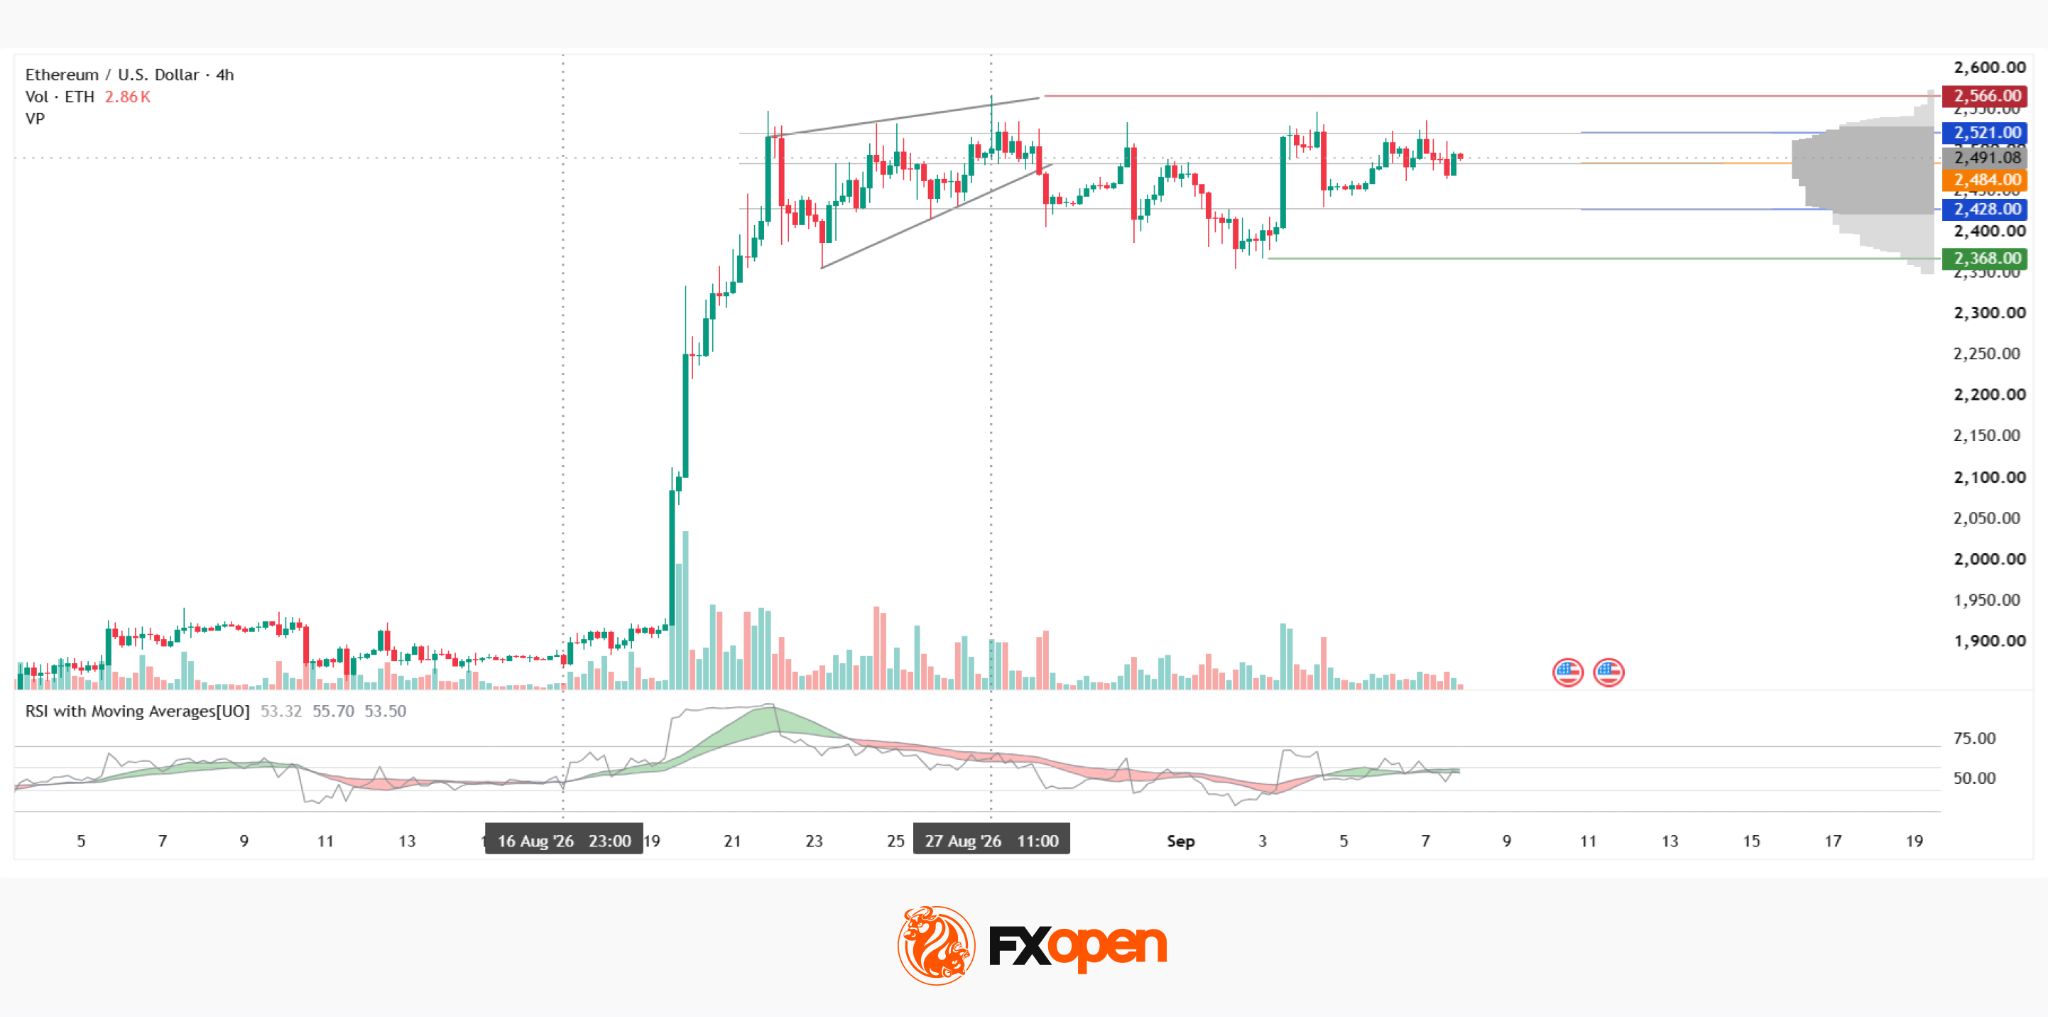
The four-hour ETH/USD chart shows a pronounced uptrend that began with a sharp impulse on volume significantly above the average levels seen in previous weeks. An ascending wedge formed near the top of this move, with price fluctuations gradually narrowing to create a classic pattern. At the end of August, the price attempted to break out of the wedge to the downside, but the breakout failed to develop, with the market returning to the boundaries of the developing market profile.
Trading within the current boundaries has continued for a relatively long period, which could indicate that energy is building ahead of the next significant move. The price is currently moving between the Point of Control (POC) at $2,484 and the upper boundary of the profile at $2,521.
Above the current market profile, near the top of the trend, there is a red resistance area around $2,566. Below it lies a green support area at $2,368, which would only become accessible if the price first breaks through the lower boundary of the profile at $2,428.
The RSI + MAs indicator is showing readings of 53, 55 and 53. The oscillator and both moving averages are holding below the upper boundary of the neutral zone and are attempting to move higher, while the moving-average lines are green.
The prolonged consolidation following the failed downside wedge breakout has yet to determine the pair’s next direction, while the RSI + MAs readings add to the potential recovery scenario. The flow of capital into spot Ethereum ETFs remains an additional point of reference for Ethereum.





