Key Takeaways
Benjamin Cowen, the crypto analyst who publicly called the Bitcoin top in Q4 2025 when price was above $110,000, returned to Altcoin Daily to lay out where the current cycle goes from here. His position is direct: there is a 75% probability the Bitcoin bottom is still ahead, and he has a checklist of conditions that have appeared at every prior cycle low to justify that view.
Cowen is not working from intuition. He is working from a pattern that has repeated across every Bitcoin bear market in history, 2011, 2015, 2018, 2020, and 2022. At each of those lows, three specific on-chain conditions appeared before the market turned. None of those three conditions have triggered in the current cycle. Until they do, his framework does not support calling a bottom.
The first condition is the crossing of the supply in profit metric and the supply in loss metric. That cross has preceded every prior cycle low without exception. It has not happened yet. The second is the MVRV Z-Score dropping below zero. Every prior midterm year bear market saw that reading go below zero before recovering. The current reading is approaching zero but has not crossed. The third is Bitcoin trading below both its realized price, currently around $54,000, and its balance price, currently around $39,000. Every prior cycle bottom occurred after Bitcoin went below both levels. It has not breached either in the current cycle.
Three conditions. Zero triggered. That is the basis of the 75%.
The most likely timeframe for the bottom, in Cowen’s assessment, is October 2026. The pattern that informs that view is consistent across prior cycles: the 2018 bear market ran from December 2017 to December 2018, twelve months. The 2022 bear market ran from November 2021 to November 2022, twelve months. If this cycle follows the same duration from its October 2025 top, October 2026 is the natural landing point.
The price target he arrives at is approximately $39,000 to $40,000, a roughly 70% decline from the all-time high. That figure is not arbitrary. It is where the balance price sits, and going below it would reset every major on-chain indicator simultaneously. The MVRV Z-Score would drop below zero. The supply in profit and loss metrics would cross. Bitcoin would trade below both the realized price and the balance price. Every item on the checklist would complete at roughly the same level.
Cowen notes that each prior Bitcoin bear market has been marginally less severe than the last, from 94% in the first cycle to 87%, 84%, 77%, and now potentially 70%. A 70% drop is the smallest bear market in Bitcoin’s history. It is also the one that fits the pattern of diminishing severity.
He is careful to add that May 2026 is a possible earlier floor if a crisis event materializes, and that if Bitcoin does not make a new low by October, he would concede the cycle low is already in. The bear market resistance band, he notes, currently sits around $78,000 to $79,000, the level that was prior bull market support and has now flipped to resistance. That is the line in the sand for the current rally.
Cowen presents the bull case himself. The 2019 analog is the framework: Bitcoin dropped roughly 50% from its peak, formed a low, then began recovering before the pandemic created a second flush. The current structure mirrors that setup, a low in February 2026 followed by a marginally higher low in April, exactly the sequence 2019 produced.
He gives it 25%, not because the analog is wrong but because the uptrend in 2019 and the downtrend in 2019 lasted roughly equal durations. If this cycle’s bull market ran significantly longer than 2019’s, the digestion phase should also take longer proportionally. A few months of recovery does not complete that digestion by his measure.
The practical implication he draws from both scenarios is the same. He does not advise waiting for the exact bottom. By summer of a midterm year, he argues, it starts to make sense to accumulate, because the money in Bitcoin is made in the middle of trends, not at the extremes. Missing the precise bottom does not mean missing the return.
Bitcoin is at $72,829 on Binance as of April 11, pressing toward the $73,000 resistance level that has capped recent sessions. The 50-period SMA on the 1H chart sits at $72,458, rising steadily since April 5 and providing the floor beneath each pullback. The RSI is at 53.54 with the signal line at 54.06, neutral, with no overbought signal present despite the sustained move higher.
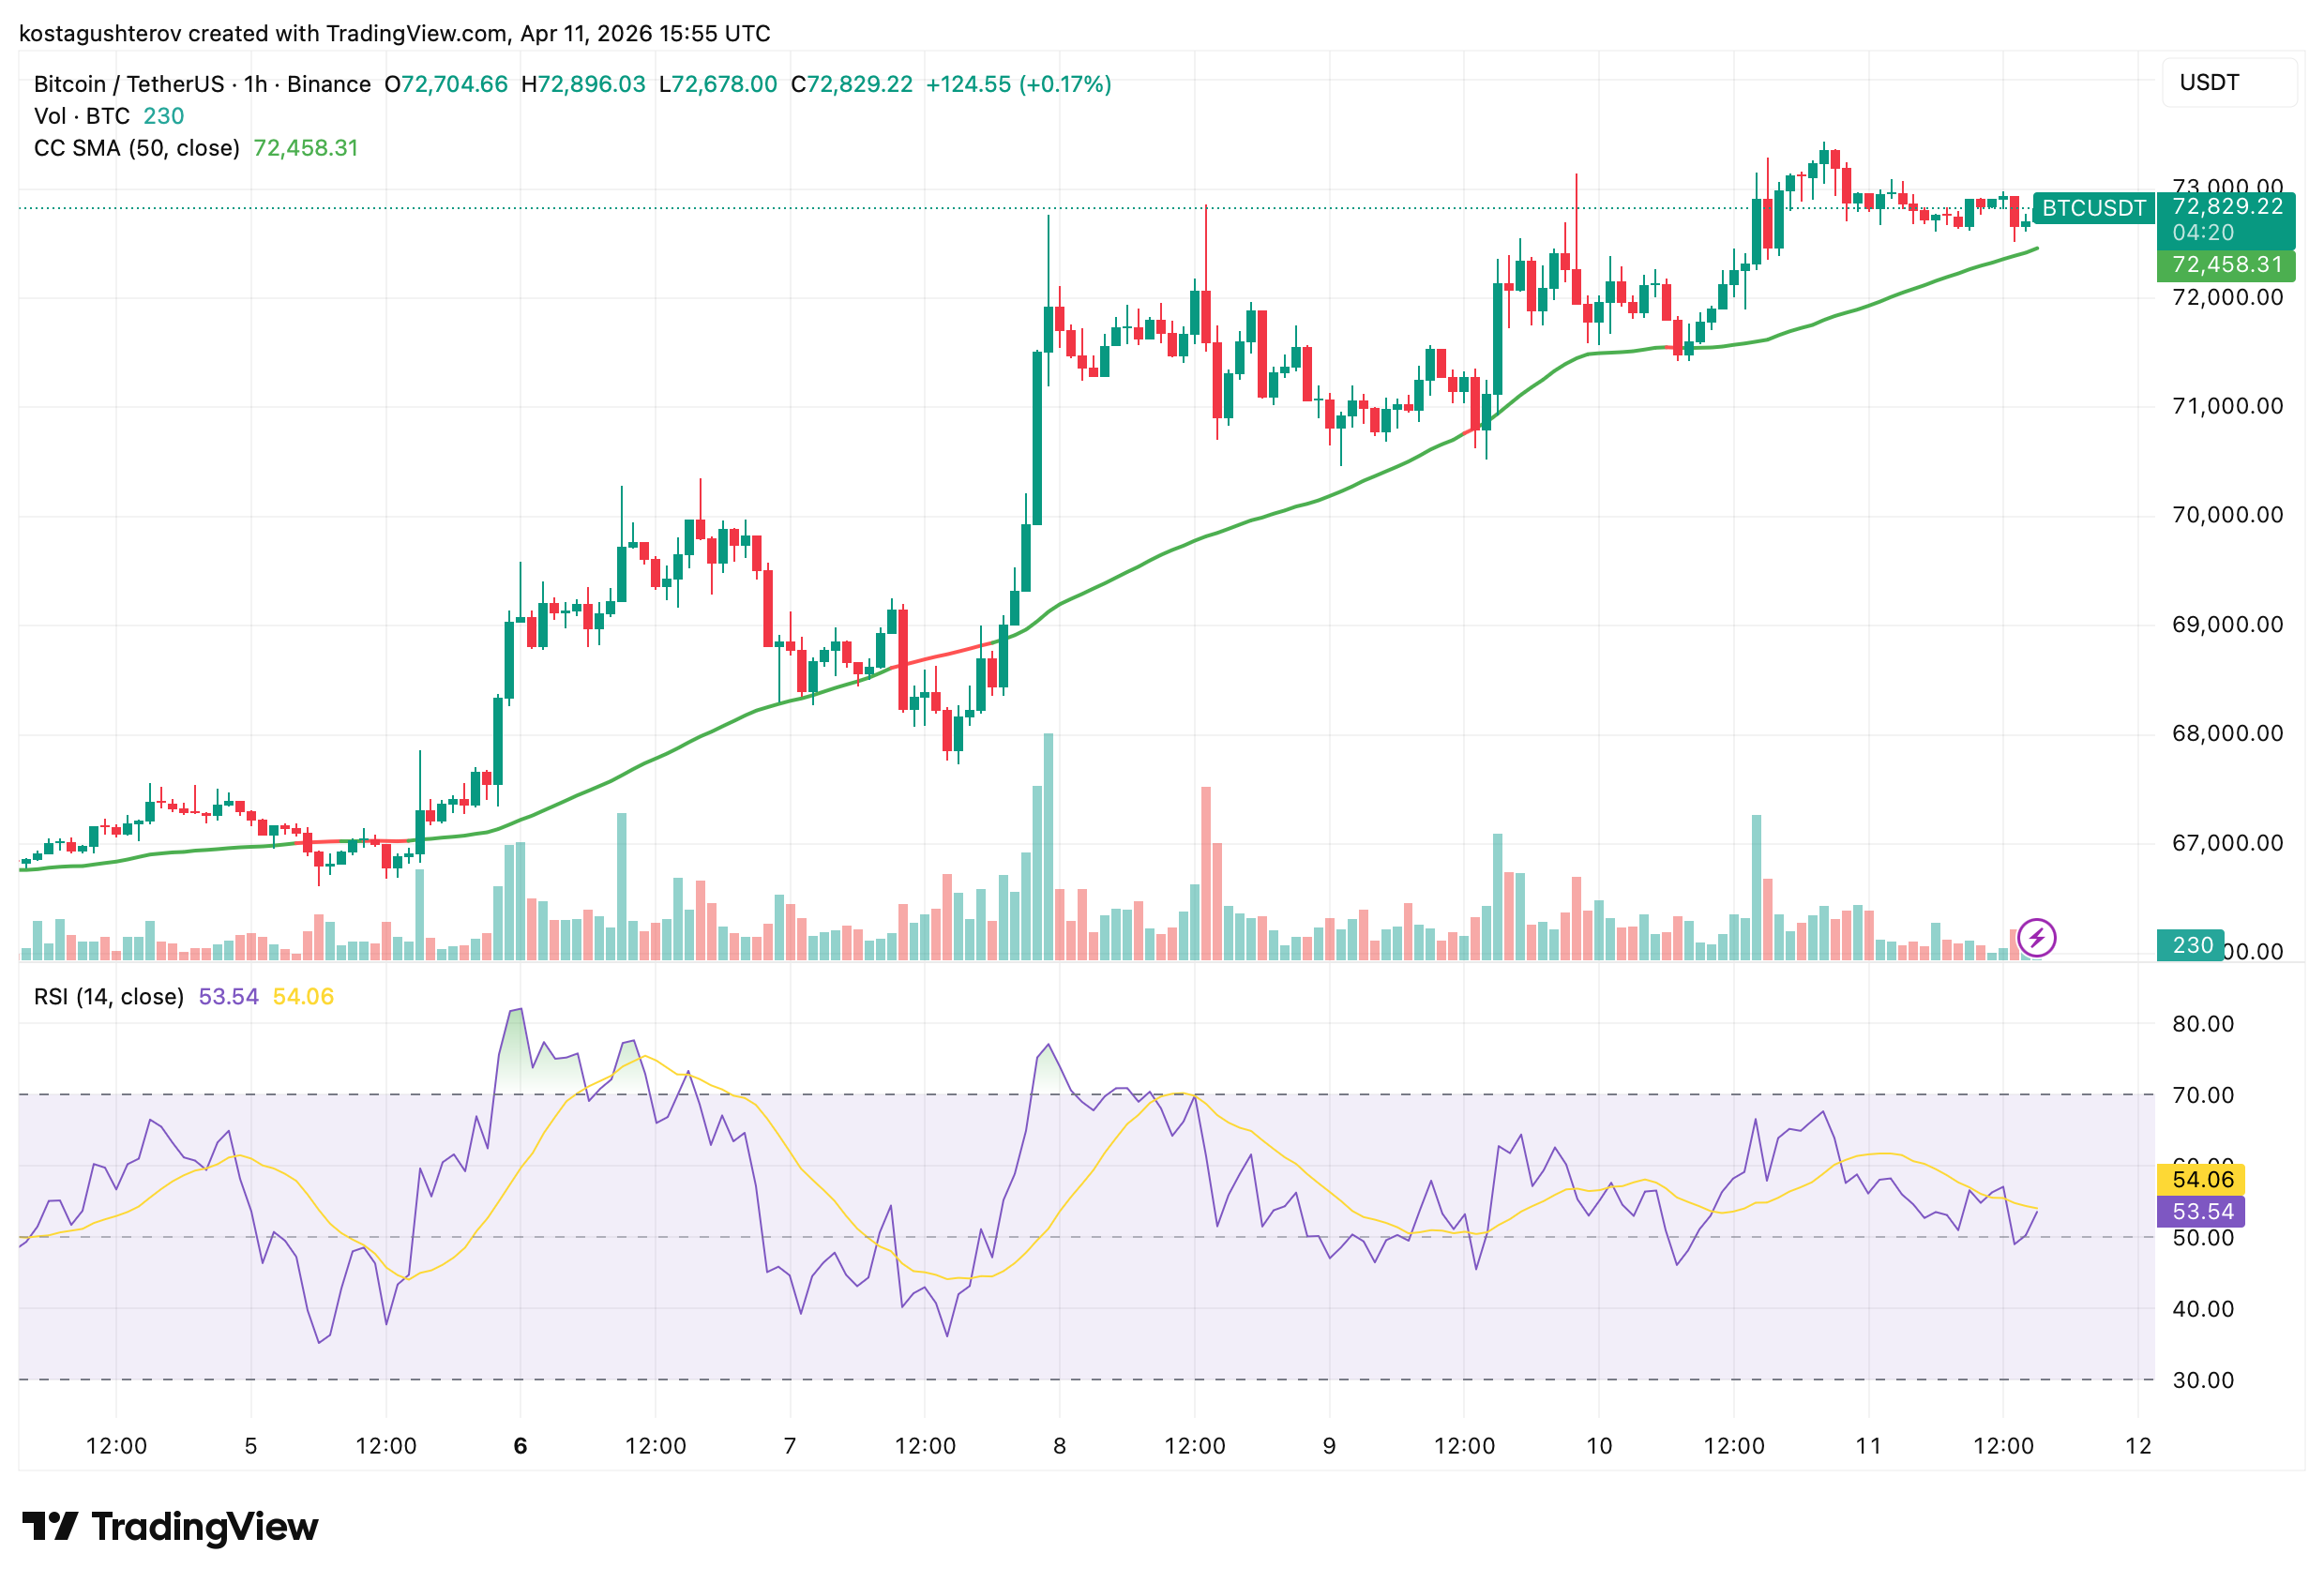
The structure since April 5 has been a textbook sequence of higher lows: $67,000, then $68,200, then $70,800, then $71,800. The ceasefire announcement on April 8 produced the largest volume candle on the chart and drove price to the current range. Unlike the broader altcoin market which retraced those gains aggressively, Bitcoin has held them, consistent with Cowen’s view that in a late business cycle environment, lower risk assets absorb liquidity while higher risk assets bleed.
The US-Iran peace negotiations in Islamabad scheduled for this weekend represent the most significant near-term price variable. A ceasefire framework that holds would remove the geopolitical premium currently embedded in oil prices, easing one of the inflationary pressures Cowen cites as a late business cycle signal. A breakdown in talks would add downside pressure across risk assets. Either outcome will move Bitcoin before Cowen’s October timeline arrives, and the chart at $72,829 pressing toward $73,000 is the market pricing the possibility that the talks succeed before pricing the possibility that Cowen is right.
The information provided in this article is for educational purposes only and does not constitute financial, investment, or trading advice. Coindoo.com does not endorse or recommend any specific investment strategy or cryptocurrency. Always conduct your own research and consult with a licensed financial advisor before making any investment decisions.
The post Benjamin Cowen: Bitcoin Bottom Is Still Ahead – Price and Timeline He Is Watching appeared first on Coindoo.


