
Manta Network (MANTA) is consolidating in a bearish price setup following the high volatility presence in the crypto market. According to CoinMarketCap, as of Saturday, April 11, the MANTA price has declined by 1.4% over the last 24 hours but remained stable over the last week.
At the time of writing, MANTA is trading at $0.06275, with a trading volume of $3.65 million, which has declined by 28.64% over the last 24 hours. However, its market capitalization stands at $29.21 million, which is also down by 1.41%.
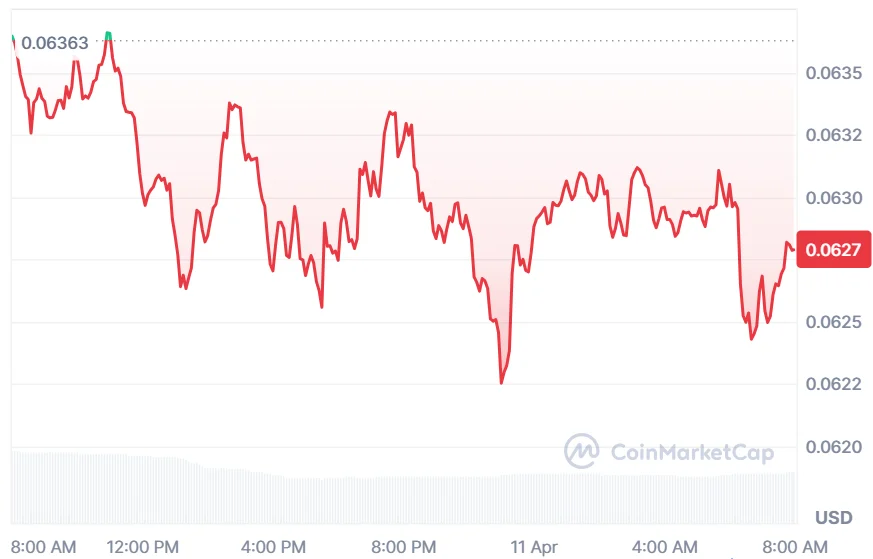
Source: CoinMarketCap
Also Read: MANTA Faces Critical Support Test Amid Downtrending Triangle Pattern
Furthermore, the crypto analyst Jonathan Carter highlighted that MANTA is drawing increased attention as technical indicators suggest a possible reversal for the MANTA token.
In the three-day timeframe, price action is testing the upper boundary of a falling wedge pattern, a formation widely viewed as bullish, where tightening structure often signals building pressure and a potential breakout driven by strengthening buyer interest.
Jonathan Carter has highlighted the fact that each failure attempt on the part of bears to shatter this resistance shows rising demand and marks the beginning of an upward move.
A breakout confirmation along with healthy volumes and closing levels above the pattern will mark a sudden change in investor attitude as more money pours in and momentum builds up for further moves up.

Source: Jonathan Carter’s X Post
After the confirmation, various price targets have been mentioned, starting from $0.10 for the first breakout level and moving up to $0.15, $0.23, $0.33, and $0.56 in a bullish case.
On the other hand, a lack of breakout may make the entire pattern void, and the trader should be careful about the high volatility in the cryptocurrency market at present.
According to TradingView, the RSI is at about 46.40, which clearly makes it neutral. Due to the fact that this indicator oscillates within the range of values from 30 to 70, this means that there is no excessive purchasing and selling power in the market right now.
The horizontal movement confirms that this asset is experiencing consolidation and requires more activity to break out.

Source: TradingView
The convergence of the lines on the MACD is close to the zero level, which means that momentum has sharply declined and a period of indecisive market sentiment ensues.
The bars in the histogram remain extremely small and in green, indicating that both the bulls and the bears are unable to take control of the market situation.
This article contains market analysis and price predictions. These are not guarantees. Crypto markets are volatile. Always DYOR. Not financial advice.
Also Read: MANTA Falling Wedge Pattern Signals Potential Bullish Reversal to $0.35

