As of September 8, Dogecoin maintains stability around the $0.090 mark, showcasing an impressive recovery of approximately 10% from the weekly bottom of $0.0817 established on September 2. During this upward movement, the popular meme cryptocurrency briefly tested $0.092 before settling into a consolidation zone spanning $0.089 to $0.091.
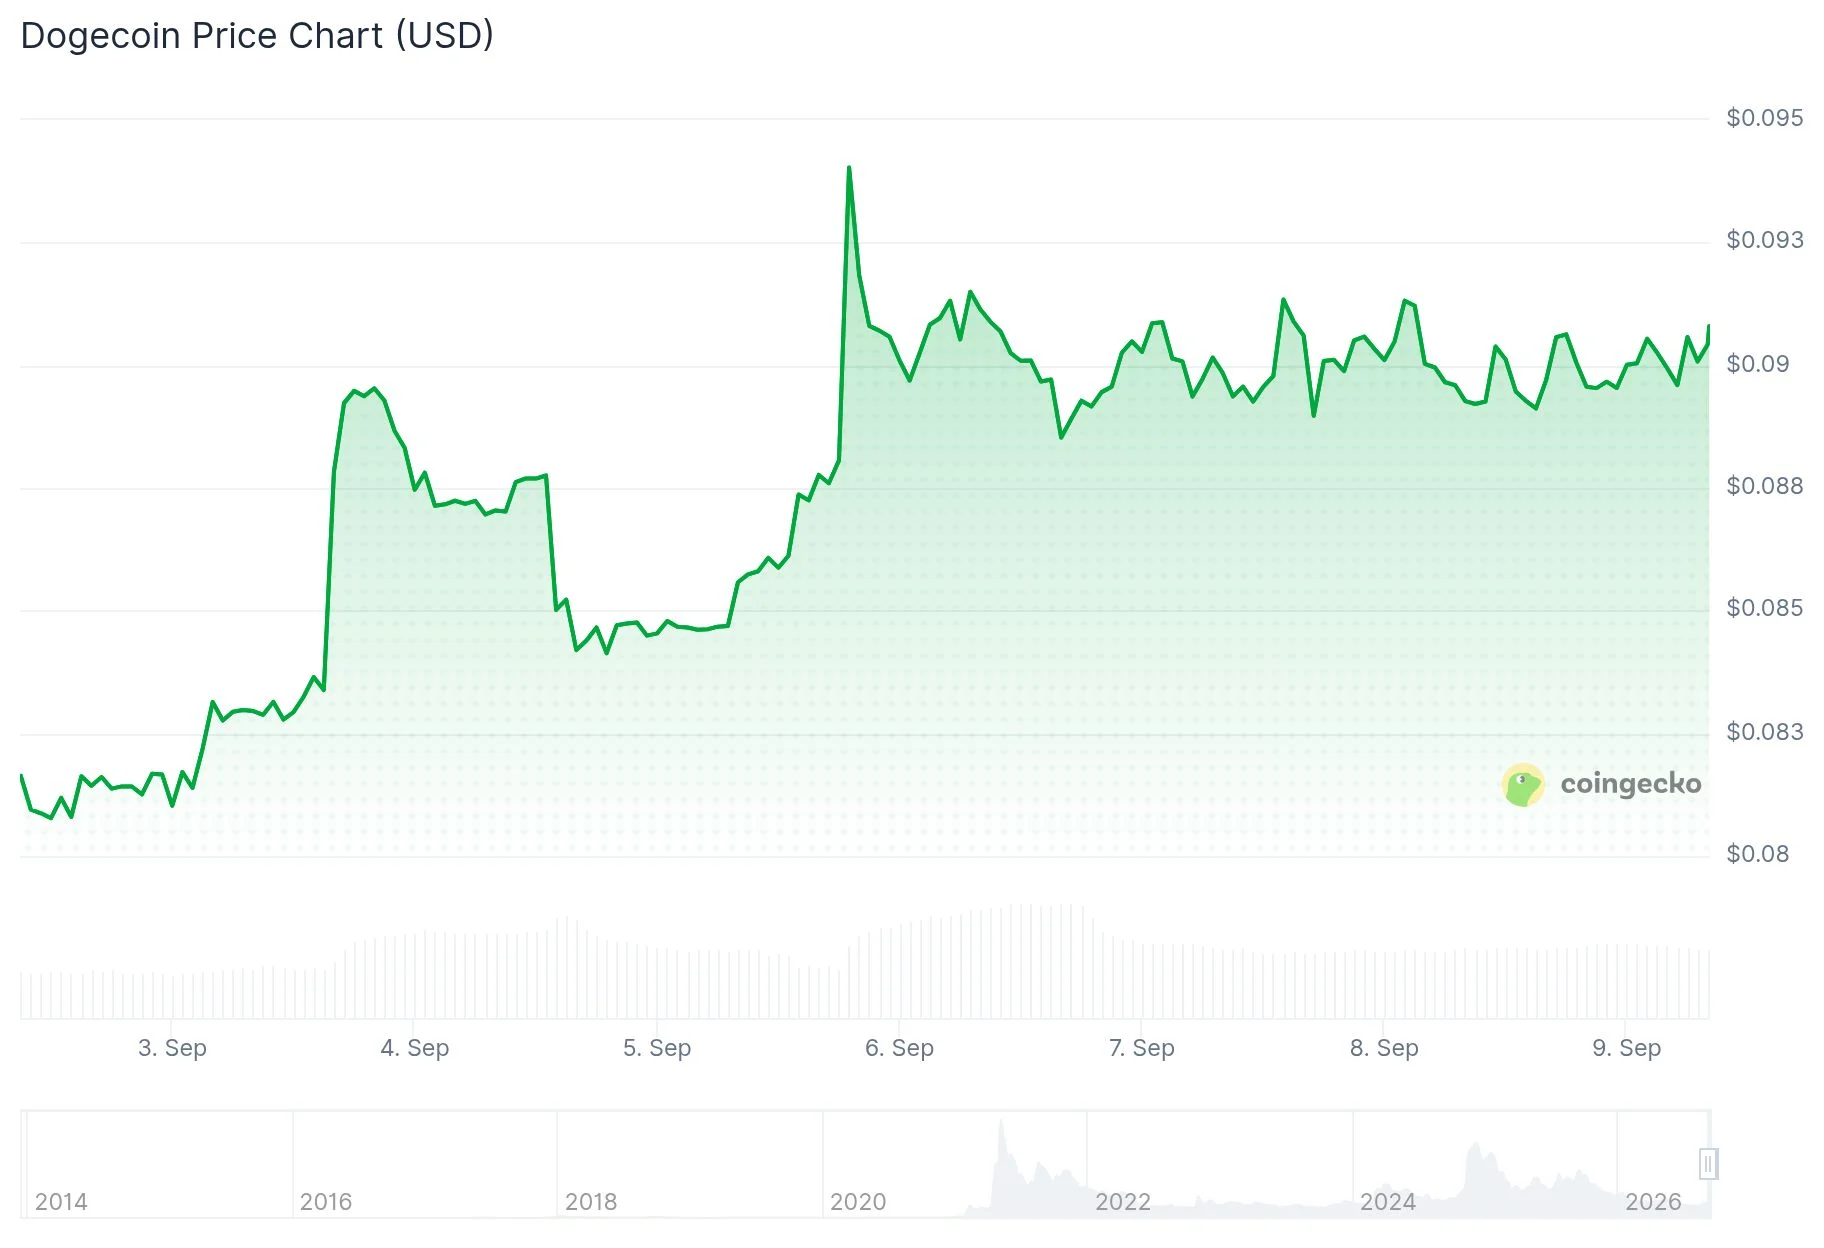
This rebound emerged after DOGE established a foundation around $0.069 during August. A significant upward surge throughout that period propelled the digital asset beyond the $0.09 threshold, although resistance prevented any meaningful advancement past $0.095.
According to CoinGlass spot market metrics, buy-side volume exceeded sell-side activity by $2.92 million on September 8. Binance specifically demonstrated $3.09 million greater purchasing flow compared to selling pressure, indicating continued buyer dominance across spot exchanges.
Futures market sentiment also reflects bullish positioning. The weighted funding rate currently stands at a positive 0.0053%, signaling that long positions outnumber short bets. Nevertheless, open interest declined 3.36% to $1.36 billion following $4.94 million in liquidated long contracts over the past 24 hours.
Examining the 4-hour timeframe reveals DOGE developing a textbook cup and handle configuration. The cup portion represents an accumulation phase, while the handle demonstrates price compression beneath resistance as volatility diminishes.
Market analyst Trader Tardigrade drew attention to this technical structure via social media, observing that a decisive breakout above the handle’s trendline—validated by increasing volume and sustained momentum—could propel prices toward the $0.10 objective. He emphasized that absent such confirmation, DOGE will likely remain range-bound with potential support retests.
$DOGE/ 12-hour
A potential Cup and Handle structure has now formed.
The cup signals accumulation, and the tight handle shows controlled consolidation under resistance as volatility contracts near the pattern’s top.
A clean breakout above the handle could target the… pic.twitter.com/EliYzEmMK1
— Trader Tardigrade
(@TATrader_Alan) September 8, 2026
The Relative Strength Index registers 54, maintaining a buyer-friendly stance, although the RSI line currently trails its signal line, indicating diminishing upward momentum. Bollinger Bands are contracting, signaling probable near-term consolidation.
Daily chart analysis shows DOGE positioned above its 20-day SMA ($0.08713), alongside the 50-day, 100-day, and 200-day SMA ($0.08839). The MACD line reads 0.00336, marginally exceeding the signal line at 0.00321, preserving bullish momentum by a slim margin.
CoinGlass three-day liquidation heatmap analysis identifies the most concentrated leveraged position cluster between $0.092 and $0.0926. Secondary liquidity pockets exist around $0.094 and $0.0965.
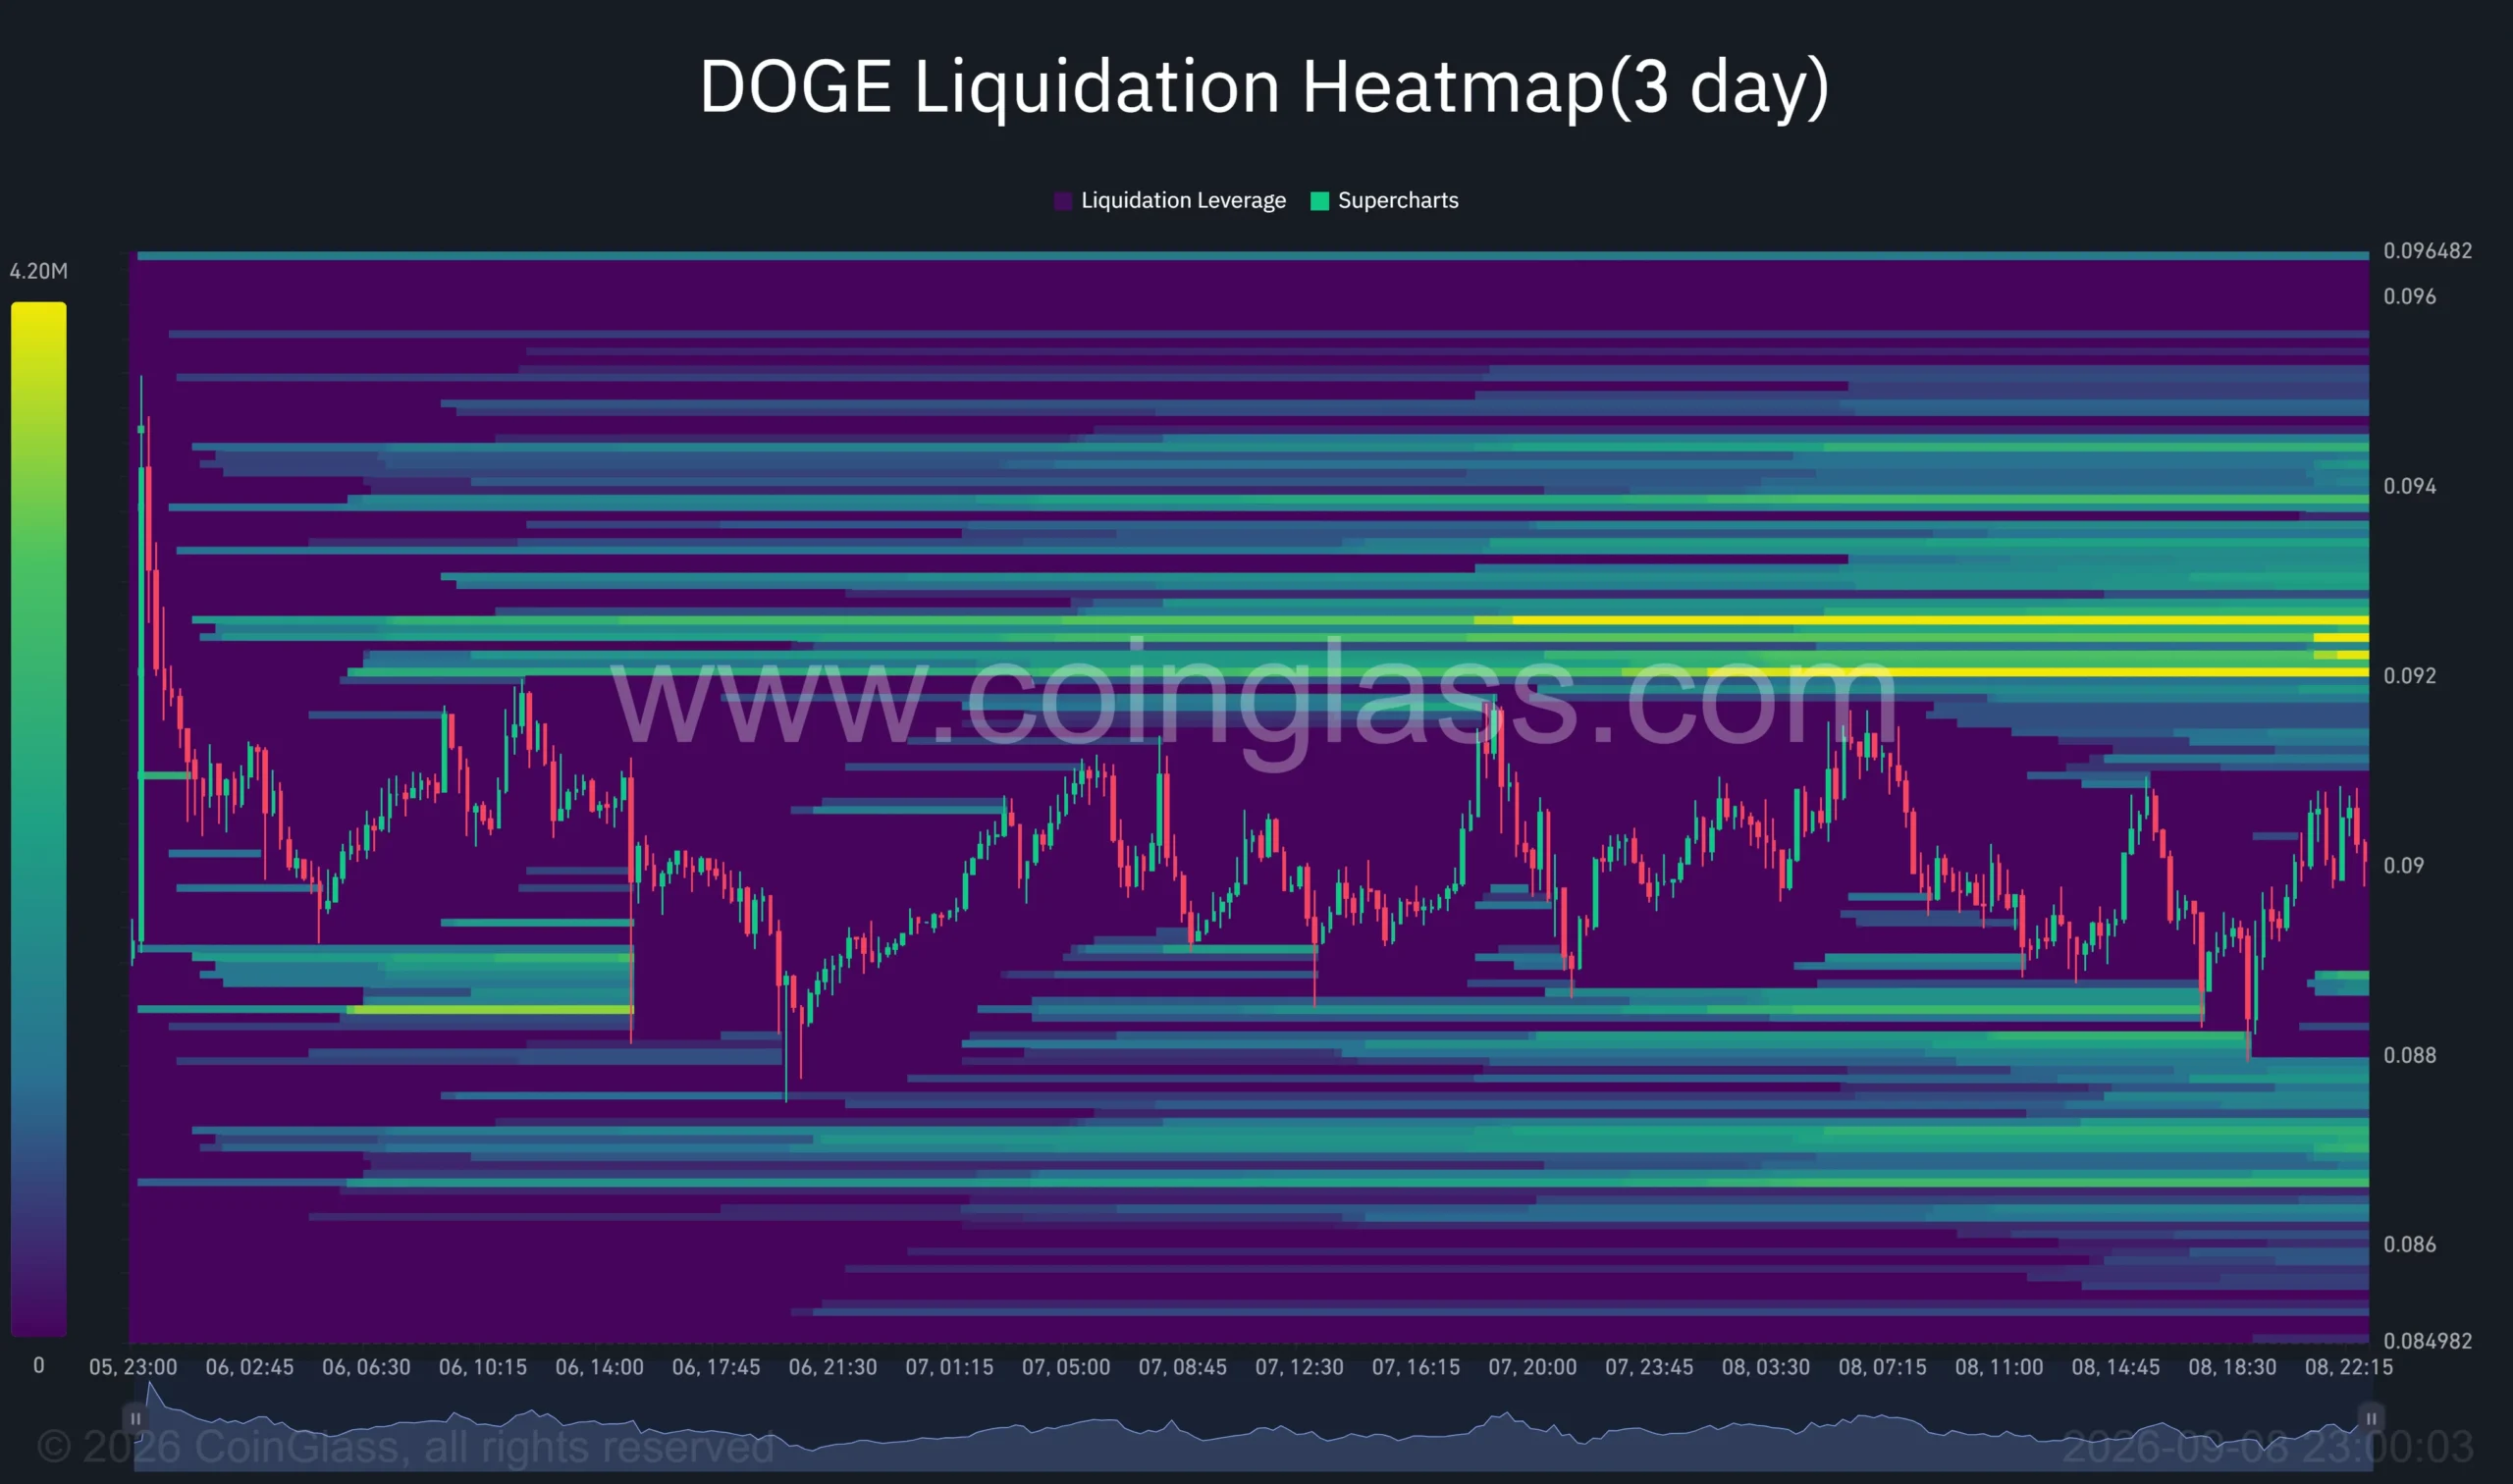
Successfully penetrating the $0.0926 barrier would expose the $0.094 level, where DOGE encountered multiple rejections throughout late August. Breaking through that ceiling could unlock pathways toward $0.0965 and eventually the psychological $0.10 benchmark.
Downside support zones include the 200-day SMA around $0.0884 and the 20-day SMA near $0.0871. The 4-hour Supertrend support currently resides at $0.0847.
The 4-hour Chaikin Money Flow indicator currently reads minus 0.05, revealing marginally negative capital movement. Additionally, DOGE ETF products experienced $343,580 in net outflows during the August 31 through September 4 period, breaking a two-week inflow streak.
The post Dogecoin (DOGE) Eyes $0.10 Breakthrough as Classic Chart Pattern Emerges appeared first on Blockonomi.





