At press time, Ethereum is changing hands at $1,887.04, registering a 24-hour trading volume of $8.05 billion alongside a market capitalization of $227.73 billion.
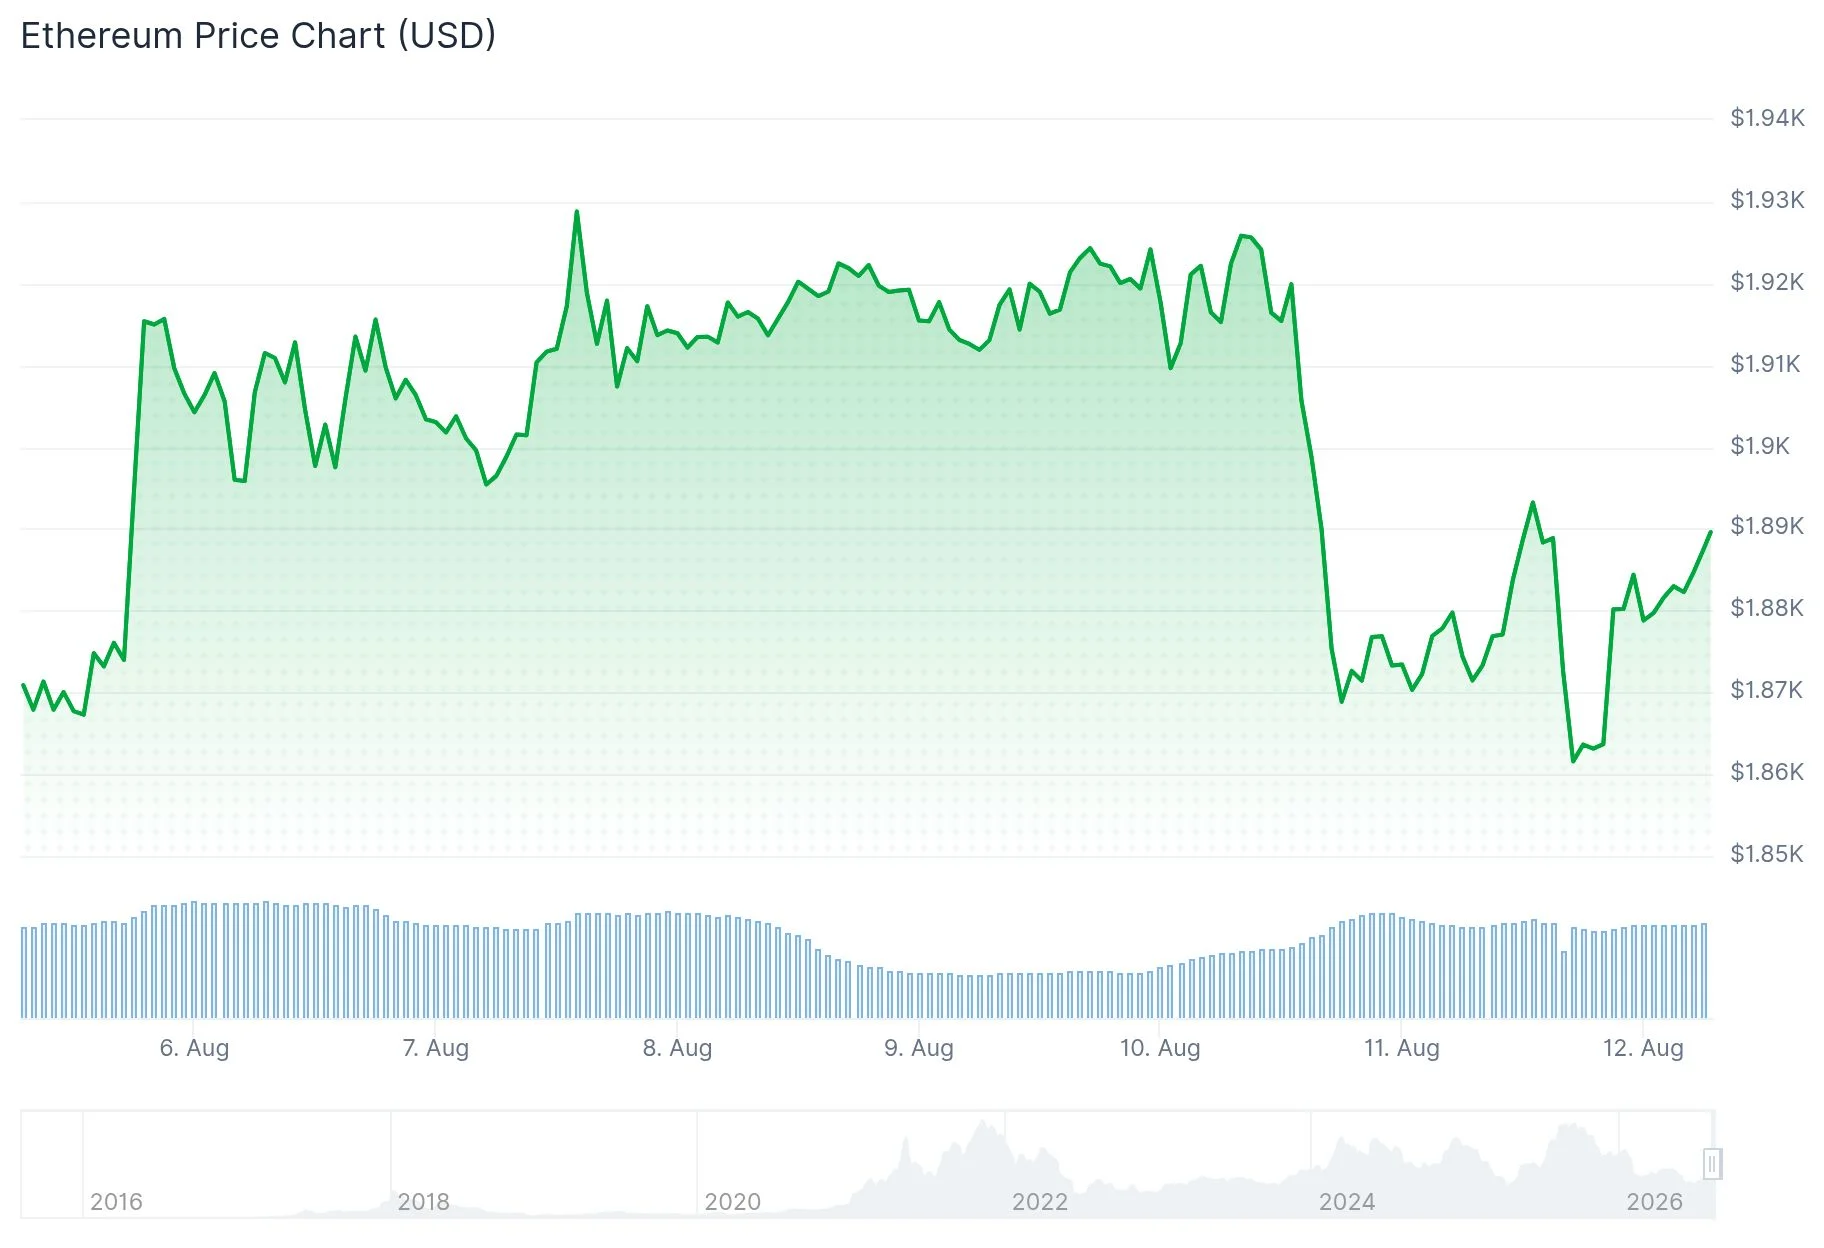
The digital asset has been consolidating within a strategic support band stretching from $1,720 to $1,780. Market analyst Nehal highlighted this range as a vital accumulation zone where demand is actively defending price levels.
Should ETH successfully maintain this range, it may establish the foundation for the subsequent upward movement. The pivotal resistance threshold to monitor sits at $1,875.
According to Nehal’s technical assessment, a convincing breakout above $1,875 accompanied by substantial volume could pave the way toward $2,200. Conversely, losing the $1,720–$1,780 support band would undermine the positive outlook.
Technical analyst Ted Pillows shared on X that Ethereum has swept equal lows while displaying RSI bullish divergence. He noted a reasonable probability that ETH has established a bottom, though cautioned about a potential dip into the $1,600–$1,700 territory before any sustained reversal.
Blockchain analytics from Lookonchain reveal that whale address 0x2d59 acquired 50,000 ETH valued at approximately $93.6 million and immediately staked the entire position. This transaction occurred merely one week following the same wallet’s purchase of 40,000 ETH worth $76.66 million.
Combined, this individual wallet has accumulated approximately $170 million in Ethereum over the past several weeks.
The decision to stake the freshly acquired ETH indicates the whale has no immediate plans for liquidation. Such patterns are frequently interpreted as demonstrating strong conviction in the asset’s long-term prospects.
Notwithstanding whale accumulation, distribution pressure has been intensifying. According to CryptoQuant analytics, the weekly Exchange Netflow metric has been trending upward throughout August, indicating increased Ethereum deposits to exchanges — typically considered a bearish indicator.
The metric experienced another surge on August 10th, corresponding with a 3% price decline that drove ETH from $1,920 down to $1,875.
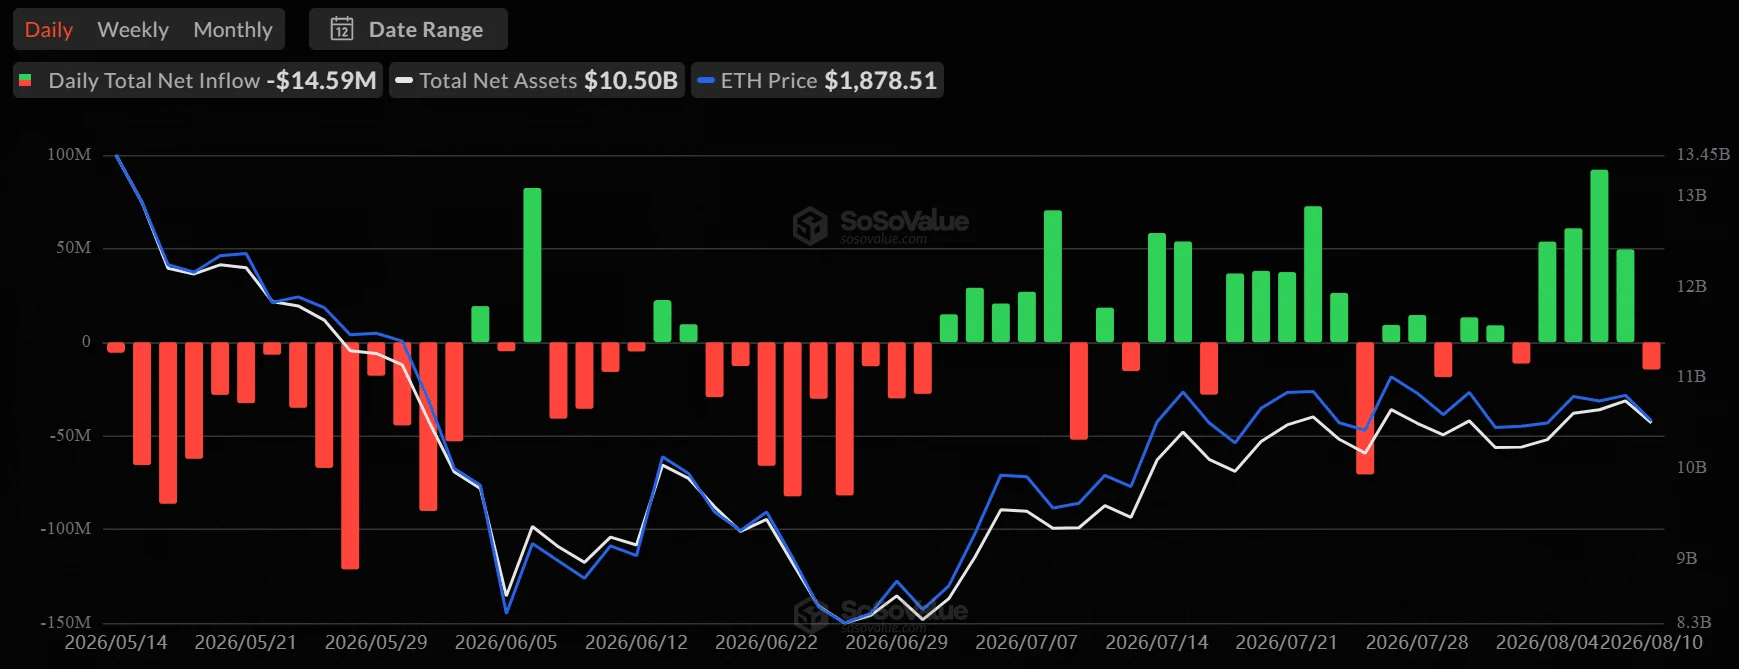
U.S. spot Ethereum ETFs registered $14.59 million in net withdrawals on August 10th, continuing a four-day pattern of negative flows.
Derivatives markets reveal institutional positioning with some bets placed on ETH achieving $2,000 by late August or September, while simultaneous hedging strategies target $1,700 and $1,650 levels.
Wednesday’s release of U.S. Consumer Price Index inflation figures represents the immediate critical catalyst. Should inflation data come in below expectations, it could reinvigorate Federal Reserve rate cut speculation and drive ETH back toward $1,900 and $2,000. However, higher-than-anticipated inflation readings might pressure prices toward $1,800 or below.
The exchange netflow metric for ETH registered another spike on August 10th, coinciding with the 3% price contraction.
The post Ethereum (ETH) Price Forecast: Will Wednesday’s CPI Data Trigger a Rally or Further Decline? appeared first on Blockonomi.





