Ethereum is trading at $1,887.04 at the time of writing, with a 24-hour trading volume of $8.05 billion and a market cap of $227.73 billion.
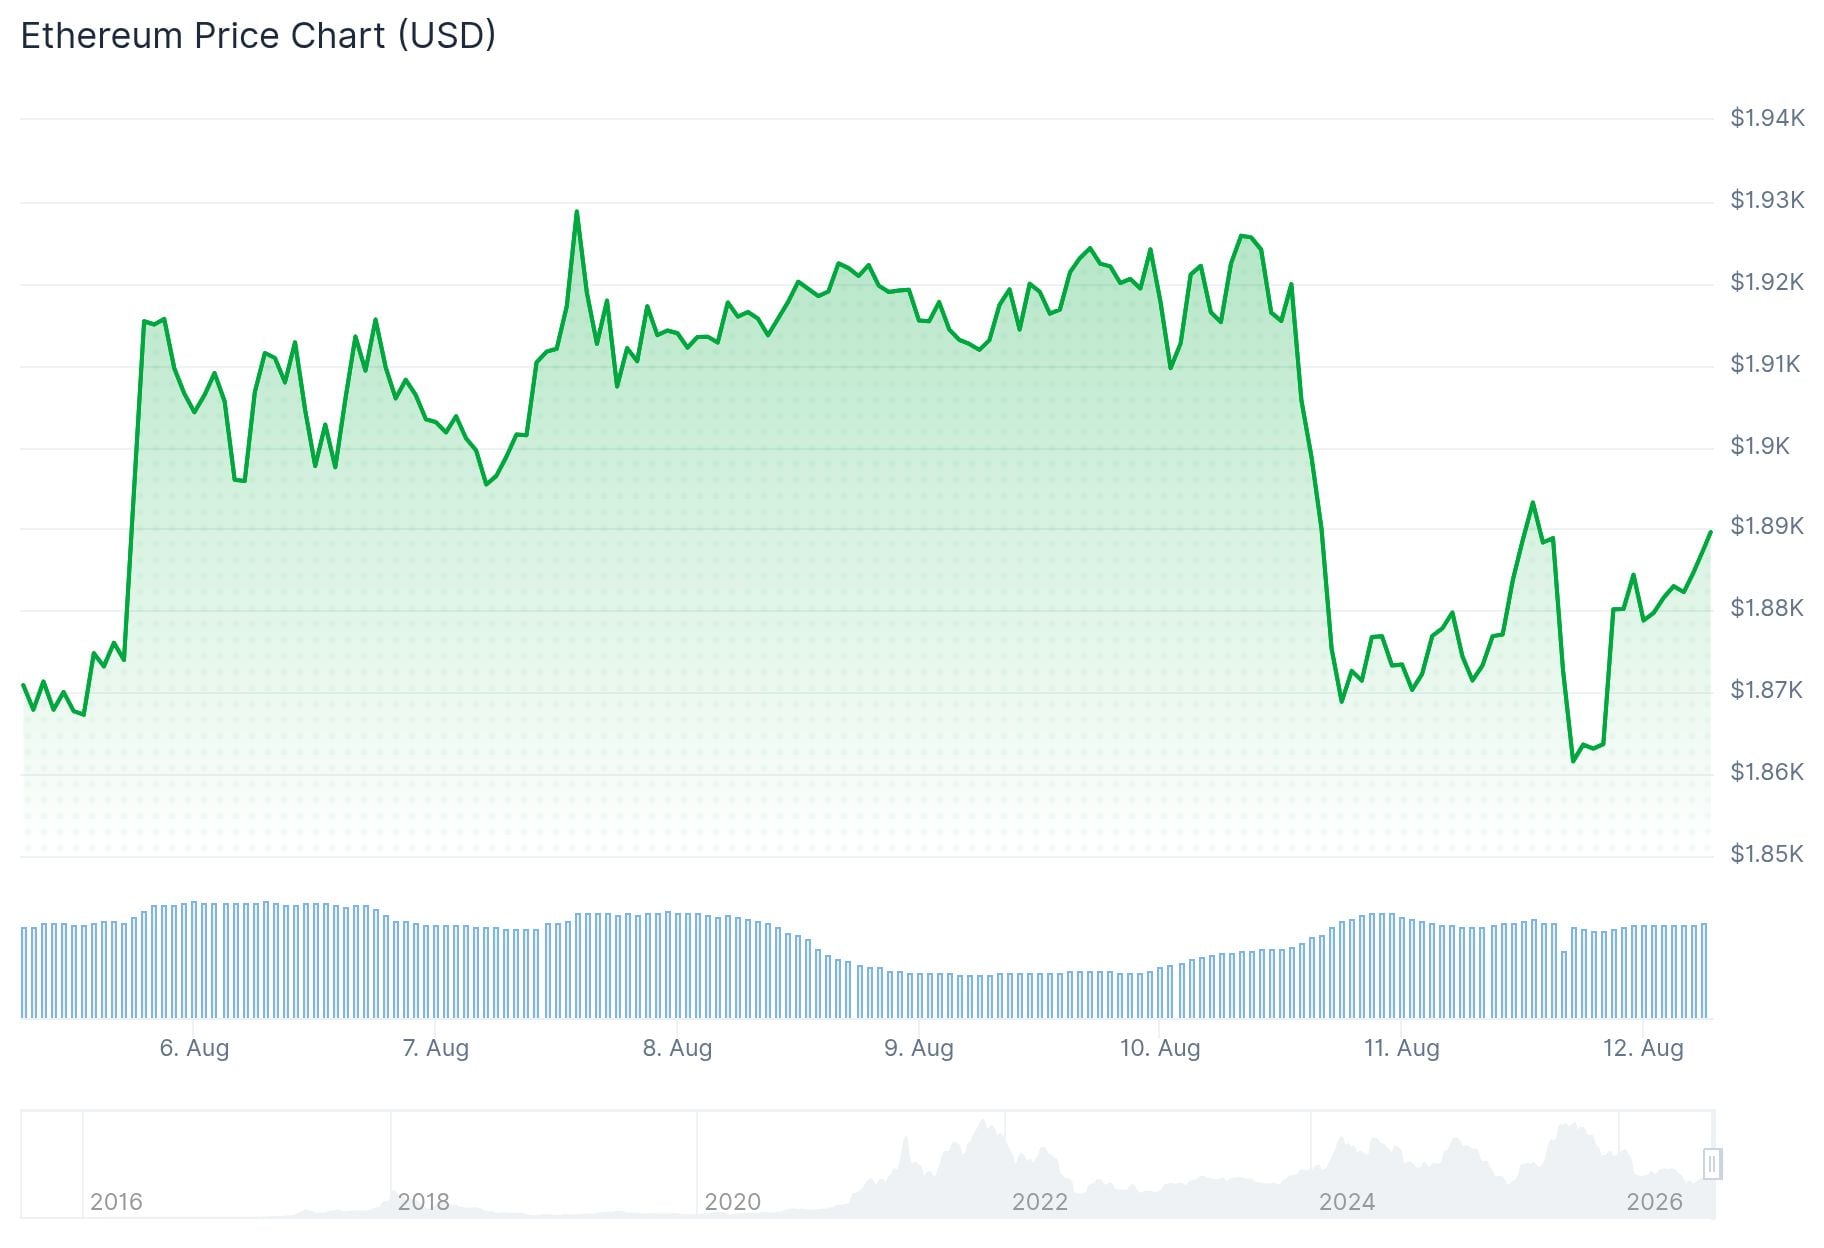
The price has been holding within a key support range of $1,720 to $1,780. Crypto analyst Nehal identified this zone as a critical buying area where buyers are working to defend support.
If ETH holds this range, it could set up the next recovery leg. The critical resistance level to watch is $1,875.
A high-volume break above $1,875 could open the path to $2,200, according to Nehal’s analysis. Failure to hold the $1,720–$1,780 zone would weaken the bullish case.
Analyst Ted Pillows posted on X that ETH has taken equal lows and is showing RSI bullish divergence. He stated there is a decent chance ETH has bottomed, but warned it could dip to the $1,600–$1,700 range before a reversal.
Equal lows taken.
RSI bullish divergence.
There's a decent chance $ETH has bottomed and could drop as low as the $1,600-$1,700 level before reversal. https://t.co/LRnBllm3BO pic.twitter.com/EAKUa2jwJS
— Ted (@TedPillows) August 11, 2026
On-chain data from Lookonchain shows that whale wallet 0x2d59 bought 50,000 ETH worth roughly $93.6 million and staked the full amount. This came just one week after the same wallet bought 40,000 ETH worth $76.66 million.
Whale 0x2d59, who bought 40,000 $ETH ($76.66M) a week ago, bought another 50,000 $ETH ($93.6M) 2 hours ago and staked it.https://t.co/4cDGG3kraKhttps://t.co/cyXF9wYiWN pic.twitter.com/vEA1jHylKf
— Lookonchain (@lookonchain) August 11, 2026
The total accumulation by this single wallet now stands at around $170 million worth of ETH in recent weeks.
The staking of the newly bought ETH suggests the whale does not plan to sell in the near term. This kind of behavior is often read as a sign of long-term confidence in the asset.
Despite whale buying, selling pressure has been rising. CryptoQuant data shows the weekly Exchange Netflow has been climbing in August, meaning more Ethereum is moving onto exchanges — a bearish signal.
On August 10th, the metric spiked again, coinciding with a 3% price drop that took ETH from $1,920 down to $1,875.
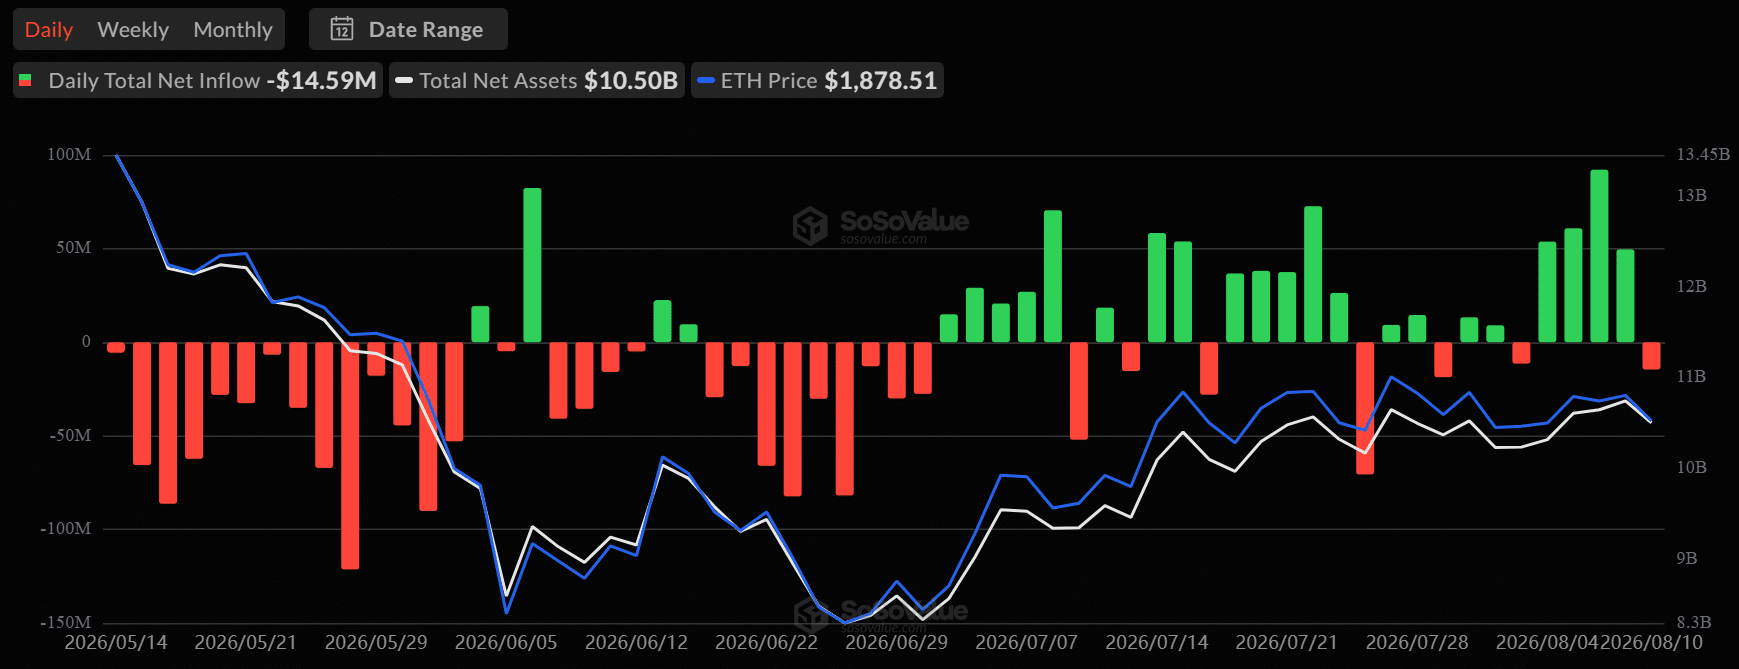
U.S. spot ETH ETFs recorded $14.59 million in net outflows on August 10th, breaking a four-day streak of outflows.
The options market shows some institutional bets on ETH reaching $2,000 by end of August or September, alongside hedging toward $1,700 and $1,650.
Wednesday’s U.S. CPI inflation data is now the key near-term catalyst. Cooler inflation could revive rate cut hopes and push ETH back toward $1,900 and $2,000. Hotter data could push prices toward $1,800 or lower.
ETH’s exchange netflow spiked again on August 10th alongside a 3% price drop.
The post Ethereum (ETH) Price: How Wednesday’s U.S. Inflation Data Could Move ETH – Watch These Levels appeared first on CoinCentral.





