Bitcoin has been trading in a tight range between $62,000 and $66,000 for much of the summer, and Tuesday was no different. BTC slipped to around $63,500, down 0.6% in 24 hours, extending a five-week standstill.
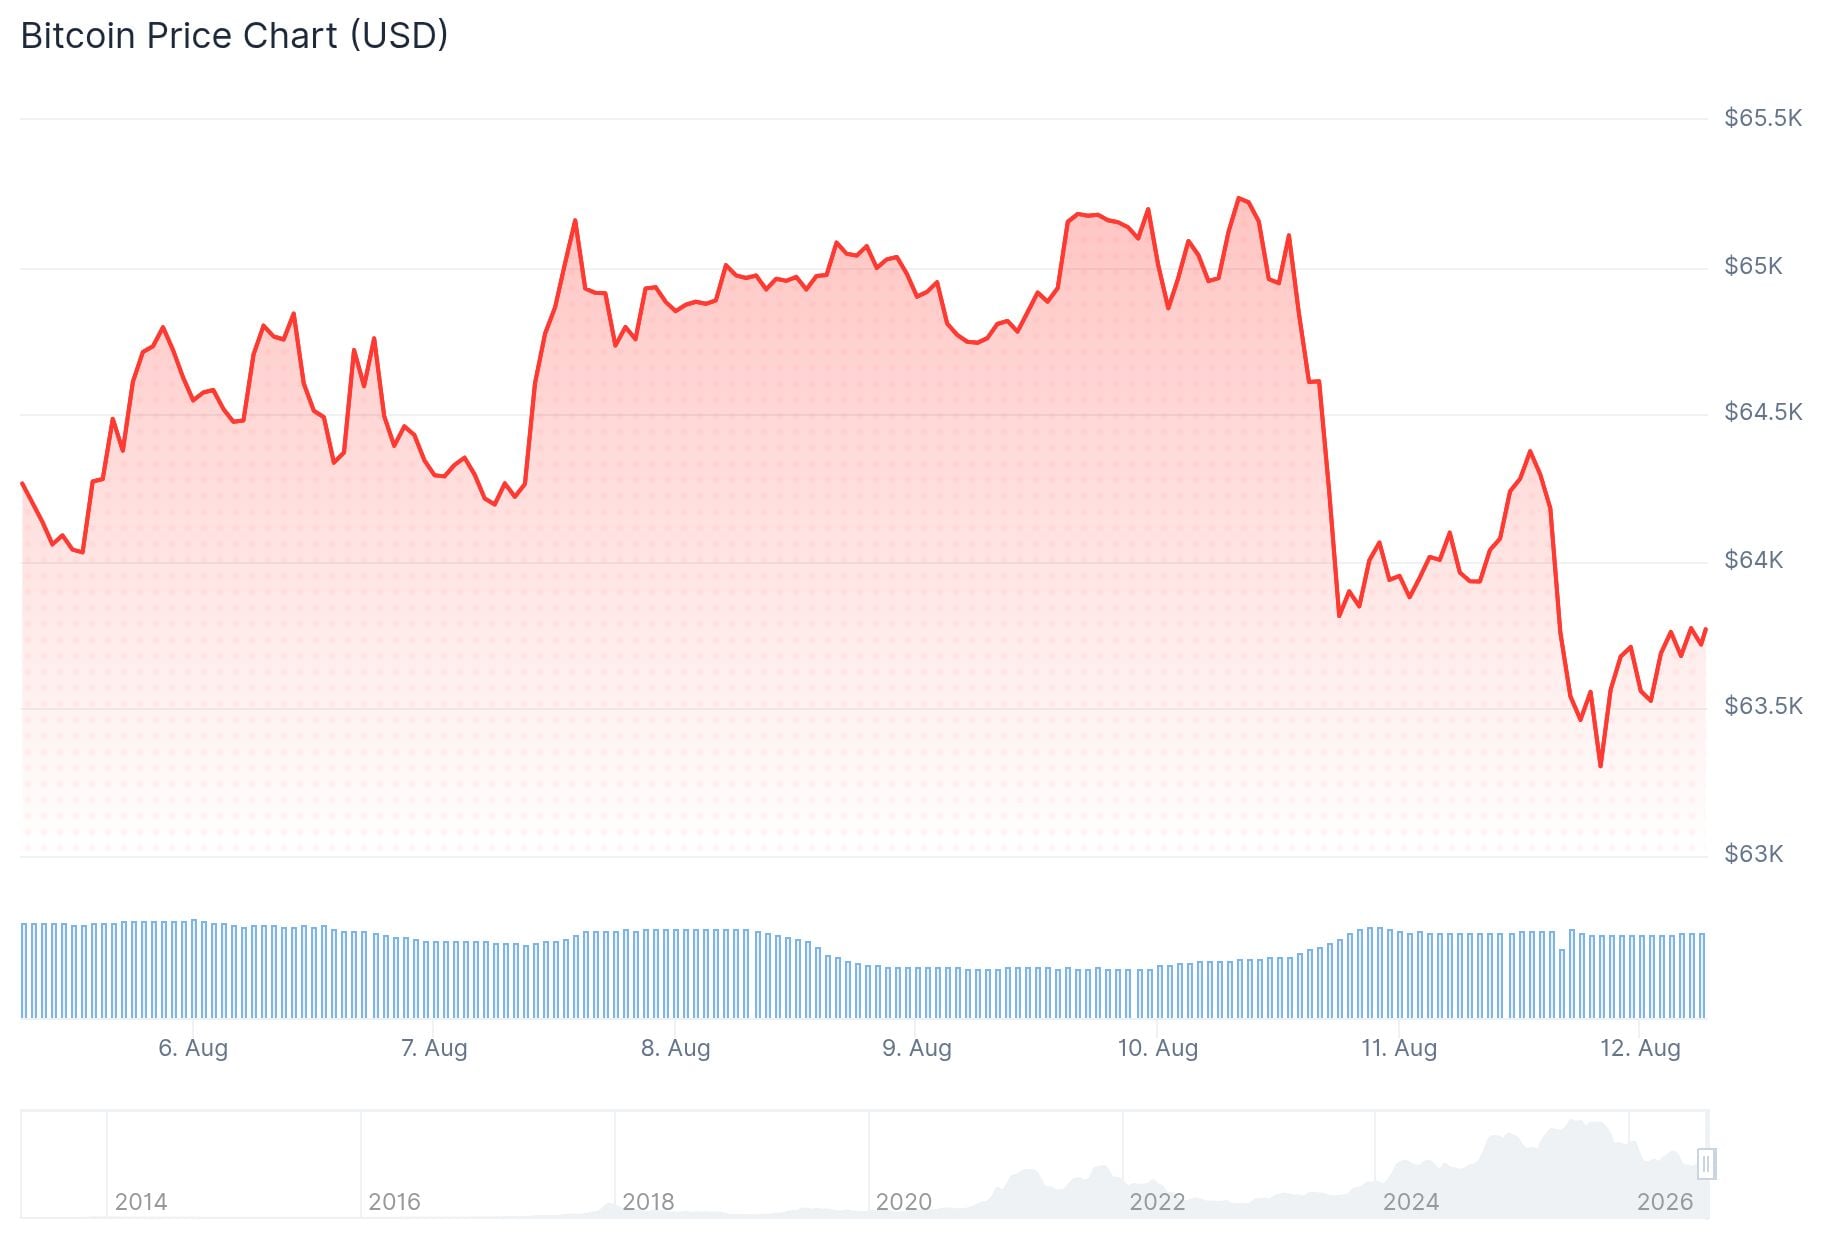
Crypto trading volumes have dropped to their lowest point in three years. That leaves little energy to push prices in either direction.
“Bitcoin’s recent price action has largely been driven by steady ETF inflows being offset by OTC selling from miners and Strategy,” said Paul Howard, senior director at trading firm Wincent.
ETF buying has been consistent, but it keeps getting cancelled out. Bitfinex analysts noted that corporate treasury activity has provided offsetting selling pressure, which is why BTC only gained around 2% last week despite strong ETF inflows.

Michael Saylor’s Strategy has sold 6,916 BTC — worth over $440 million — since June, making four consecutive sales. Two were used to fund a USD reserve, while the other two funded MSTR share buybacks.
This marks a clear shift from Saylor’s original position of never selling Bitcoin. Whale wallets have bought around 30,000 BTC in August alone, but Strategy’s selling has added to the downward pressure.
The Coldcard wallet hack added another layer of uncertainty. Estimates put losses between 1,400 and 1,700 BTC, valued at over $100 million.
Wednesday’s U.S. CPI inflation report is now the market’s main focus. It’s the first major inflation reading since Fed Chair Kevin Warsh’s inflation-focused press conference after the July Fed meeting.
“Conviction is thin on both sides as summer illiquidity reigns supreme,” said Jeff Anderson, managing partner at STS Digital.
On the weekly chart, a buy signal triggered when the RSI hit 30 remains active. This signal has marked the end of bear markets on two out of three past occasions.
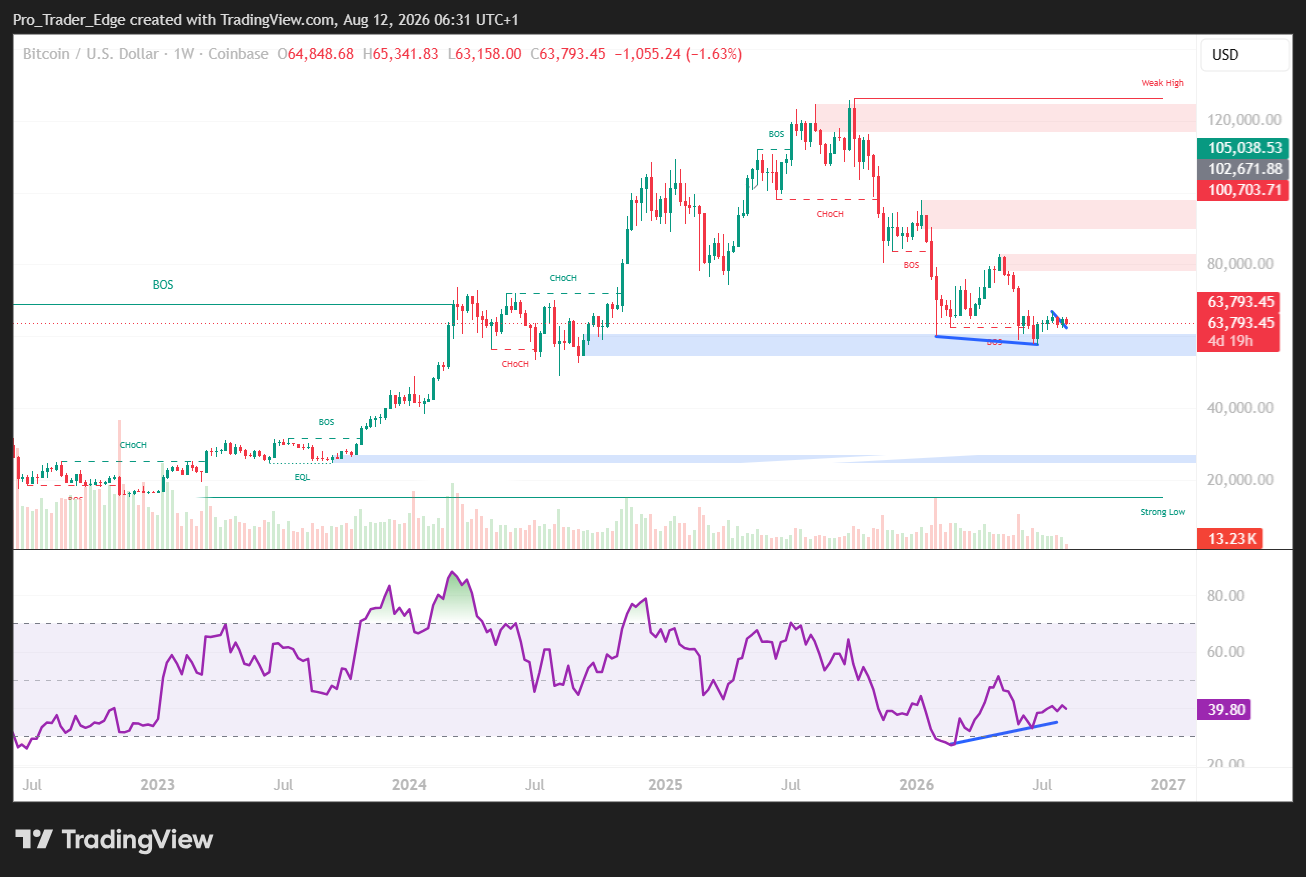
However, $60,000 is the level to watch. A break below that would weaken the case for this signal playing out again.
Analyst Ted Pillows pointed out on X that Bitcoin pumped 10.75% in the week after June’s CPI release and 7.58% after July’s. With another CPI report due Wednesday, he simply asked: “What’ll happen this time?”
$BTC pumped after the last 2 CPI data.
June CPI: Bitcoin pumped 10.75% in a week.
July CPI: Bitcoin pumped 7.58% in a week.
Tomorrow, US CPI data will released again.
What'll happen this time? pic.twitter.com/IYfFCl70PT
— Ted (@TedPillows) August 11, 2026
September has historically been Bitcoin’s weakest month, averaging a 4% decline since 2013, according to CoinGlass data.
The post Bitcoin (BTC) Price: BTC Has Gone Nowhere for Five Weeks — Will Inflation Data Finally Move It? appeared first on CoinCentral.





