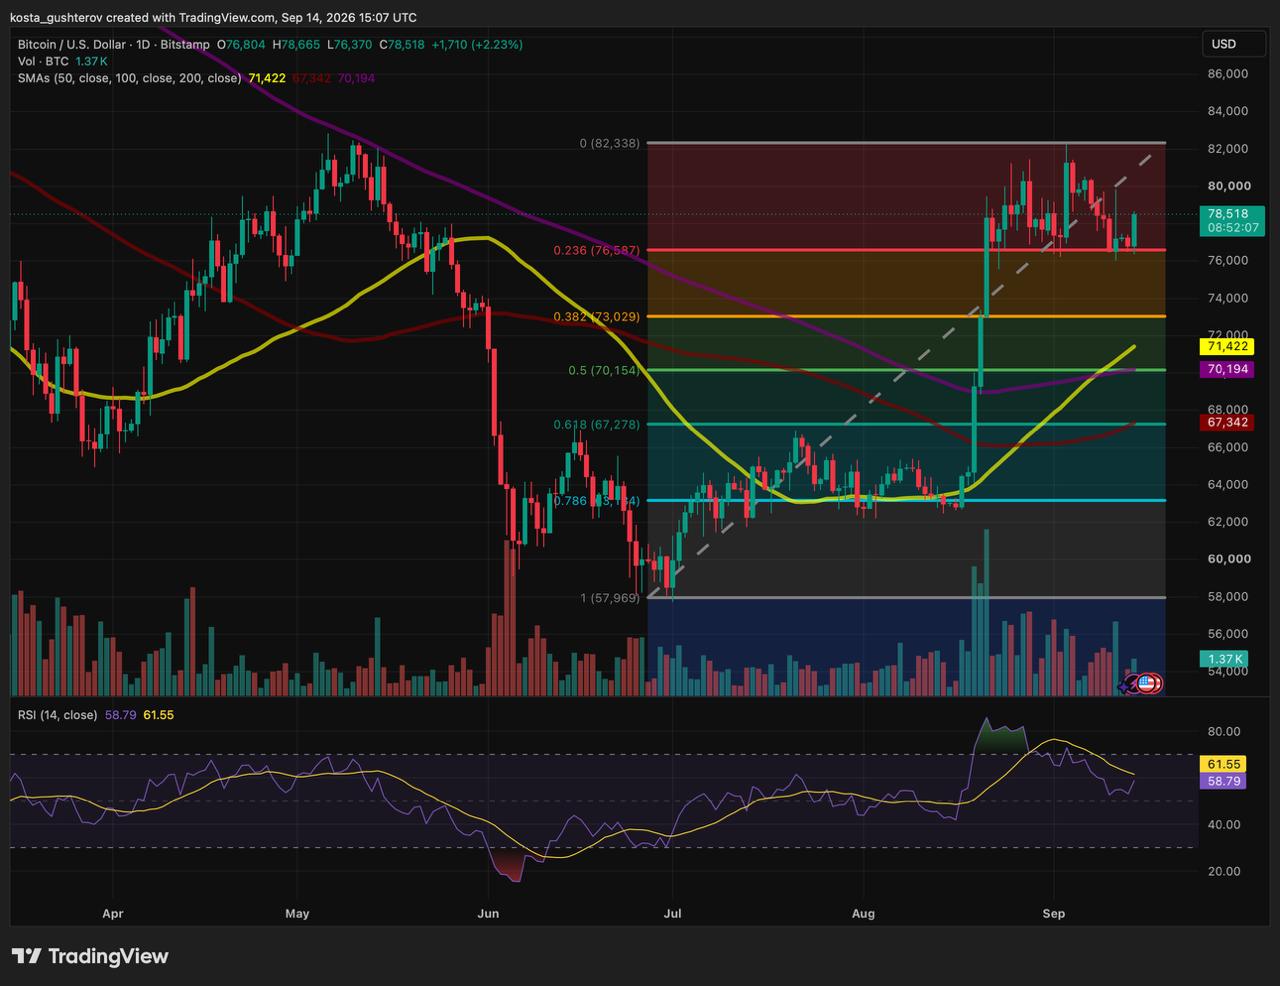
Bitcoin traded near $78,400 at the time of writing after the $76,500-$77,000 range held through two pullbacks. The area had capped Bitcoin’s earlier advance, but price is now bouncing from it instead. That is an early sign that the former ceiling may be turning into a floor, although the daily close is still needed to confirm the latest retest.
Our previous Bitcoin price analysis identified the area as an important support zone. The current reaction suggests that the level is still attracting demand, although the daily candle must close before the retest can be treated as settled.
The level also matches the 23.6% Fibonacci retracement at $76,500. The retracement is measured from Bitcoin’s June low near $57,700 to the August high of $82,300. In practical terms, Bitcoin has given back part of that rally and is now testing whether the first major retracement can hold.
On the daily timeframe, Bitcoin remains above the 50-, 100- and 200-period moving averages shown on the chart. Its RSI has also moved back above 50, which supports the recovery from the mid-$70,000s.
The picture changes on the weekly chart. Bitcoin remains below its 50-week SMA and has not yet overcome the horizontal resistance above it. This leaves the rebound caught between a support level that is holding below and a broader resistance area that has yet to give way.
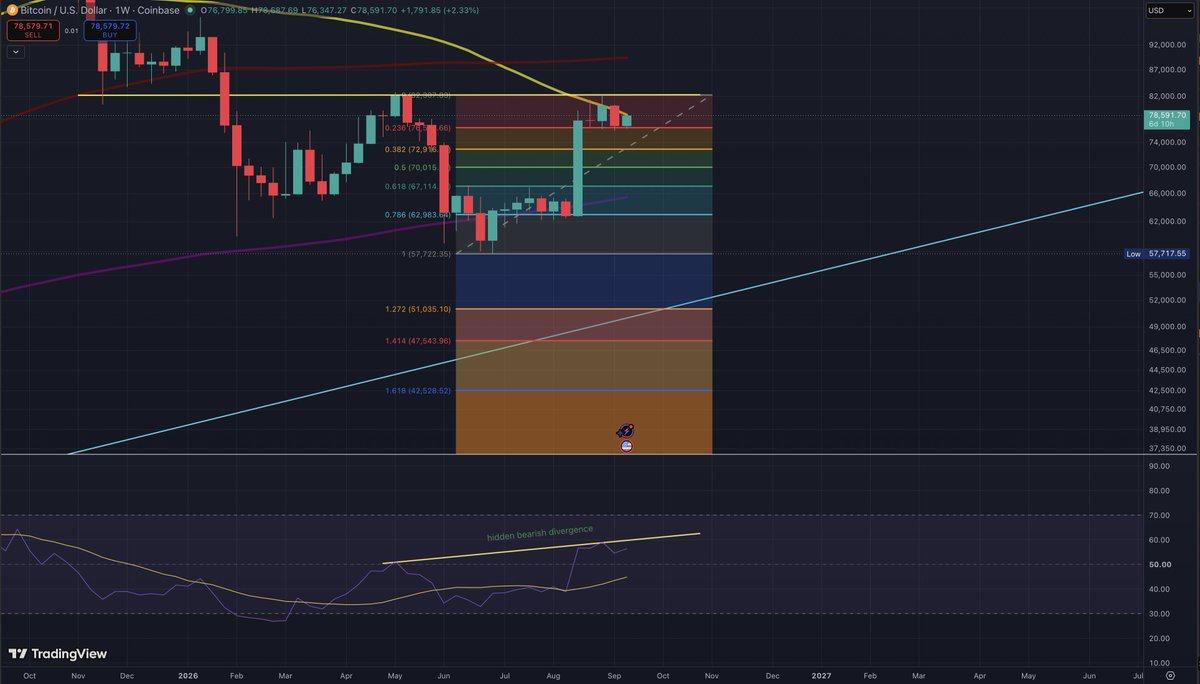
The weekly RSI adds another reason to avoid treating the bounce as a completed trend reversal. It is forming a potential hidden bearish divergence: price has made a lower high, while the RSI has made a higher high. The weekly candle was still open when the chart was checked on September 14, so the signal remains unfinished.
Hidden bearish divergence is usually read as a continuation warning rather than a prediction. It becomes more meaningful if price stalls beneath resistance and turns lower again. A decisive move above the resistance range would weaken that reading.
The next challenge begins near $80,000, where the current rebound meets a psychological barrier and the 50-week SMA. Above that sits $82,300, the August high that defines the recent lower-high structure on the weekly chart.
A move through $80,000 would show that the rebound has room to extend. Bitcoin would then need to establish itself above the 50-week SMA and close above $82,300 before the weekly structure could improve materially. That sequence would also reduce the significance of the developing bearish divergence.
Above $82,300: Bitcoin would break the immediate lower-high pattern that is still visible on the weekly chart.
Below $76,500: The daily support zone would fail, putting $73,000-the 38.2% Fibonacci retracement—back into focus.
A close below $76,500 would matter more than a brief dip below $76,580. The first price would lose the exact Fibonacci level; the second would show that Bitcoin had also lost the broader support range around it.
The first downside reference would be the 38.2% retracement near $73,000. Below that, the chart shows a larger support area between $70,000 and $71,400, where the 50% retracement at $70,150 overlaps with the daily 200-period SMA near $70,200 and the daily 50-period SMA near $71,420.
Those deeper levels are not the current trend. They show where the pullback could extend if repeated visits to $76,500 eventually exhaust the demand that has held the zone so far.
Bitcoin’s defence of $76,500-$77,000 keeps the daily recovery alive. The next question is whether the rebound can clear the 50-week SMA and the August high. That test comes during a busy week for crypto, with the Senate’s CLARITY Act vote and the Federal Reserve decision both likely to shape risk appetite.
Chart methodology: Coinbase BTC/USD data from TradingView, captured on September 14, 2026, at 15:00 UTC. Fibonacci levels were measured from the June low near $57,969 to the August high of $82,300.
This article is provided for informational purposes only and does not constitute financial or investment advice. Technical levels can change as market conditions develop.
The post Bitcoin Price Rebounds From $76,500: Resistance Levels to Watch appeared first on Coindoo.





