LTC is currently trading at $114 with a 0.26% daily increase. Over the last week, the coin lost 0.38%, and its momentum is flat relative to that of the market. The trading volume has decreased by 9.02% and currently stands at $532.45 million, an indicator of low activity. The price action is stagnant and below the resistance, awaiting signals of the breakout that may form the next action.

Source: CoinMarketCap
Analyst Rose Premium Signals highlighted that Litecoin has two major upside targets pegged at $141.54 and $194.22. The coin has just bounced after a Fibonacci support zone that has strengthened its technical structure and indicated the presence of strength. This recovery has laid down a platform for further profitable gains in case the resistance levels are overcome.
Analysts note that the market is currently targeting this area of resistance. A successful escape of this barrier might lead to greater momentum and price growth. Traders consider this area to be the factor that will define whether LTC will be further consolidating or will have a greater upward movement.

Source: X
The relative strength index (RSI) is 49.25, and the signal line is 50.87, slightly higher. These levels are considered neutral momentum, and no overbought or oversold indication is shown. A steady trend above the 50 would be a pointer to rising purchasing power. The traders are attentive to this change, which may affirm a rise in demand and provide an initial signal of the trend’s continuation.
Also Read: XRP Poised for Growth: Technical Signals Point to Potential Breakout Above $3.60
The Moving Average Convergence Divergence (MACD) indicator reflects a guarded bullish signal. The MACD line is at 0.16, which is slightly higher than the signal line at 0.12. The histogram has also hit a recent peak of 0.27, which is the mild positive momentum. Analysts warn that to maintain any breakout, a greater trading volume is needed despite the narrow crossover signaling the initial upward pressure.
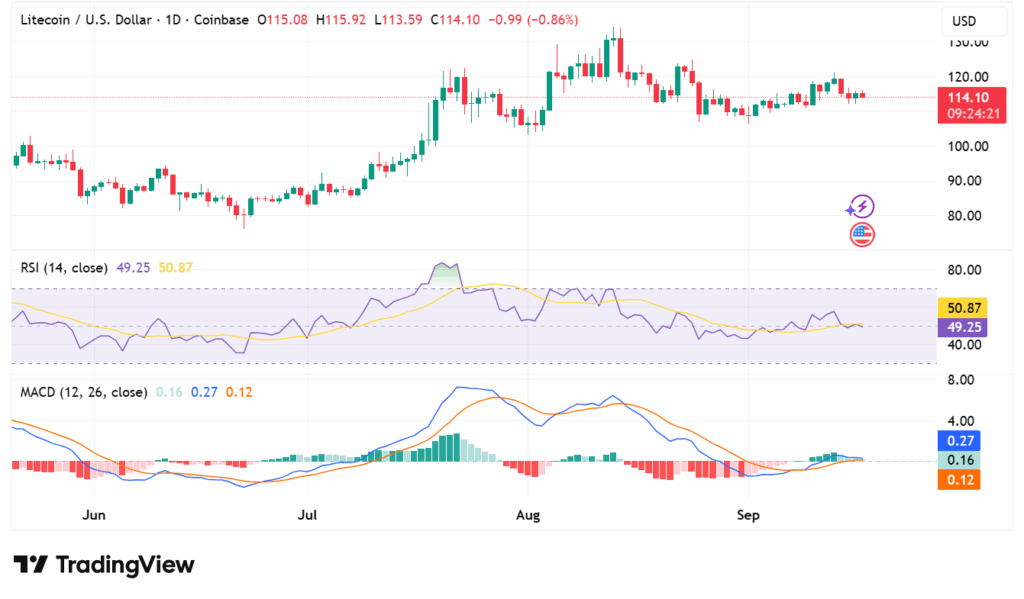
Source: TradingView
According to CoinGlass data, the trading volume decreased by 2.83 percent to $730.34 million, whereas Open Interest increased by 1.59 percent to $987.53 million. The OI-Weighted Funding rate is at 0.0069%, which indicates a positive tilt in market positioning. This implies traders are becoming bullish despite weak spot activity.
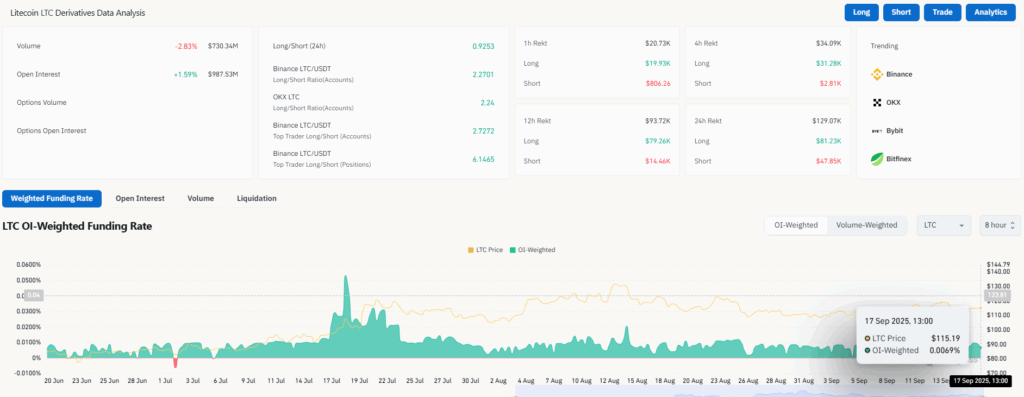
Source: CoinGlass
Also Read: Ethereum Price Prediction: ETH Eyes $4,750 After Wedge Breakout Signal


