
The diamond chart pattern is a rare yet important formation that often reflects the end of a prevailing trend. Characterised by an initial broadening phase followed by contraction, it reflects market indecision before momentum shifts decisively. The pattern serves as a reference point for analysing trend exhaustion and the structural changes that often accompany it.
In this article, we consider the structure, market psychology behind the pattern, and its practical application.
The diamond is a reversal chart pattern. It typically occurs after an extended trend and indicates a period of consolidation before a potential breakout in the opposite direction.
The diamond pattern can be either bearish or bullish, and it is also known as the diamond top pattern and diamond bottom pattern for trading. A bearish formation typically occurs during an uptrend and signals a potential reversal to the downside, while a bullish diamond pattern in trading forms during a downtrend and signals a potential reversal to the upside.
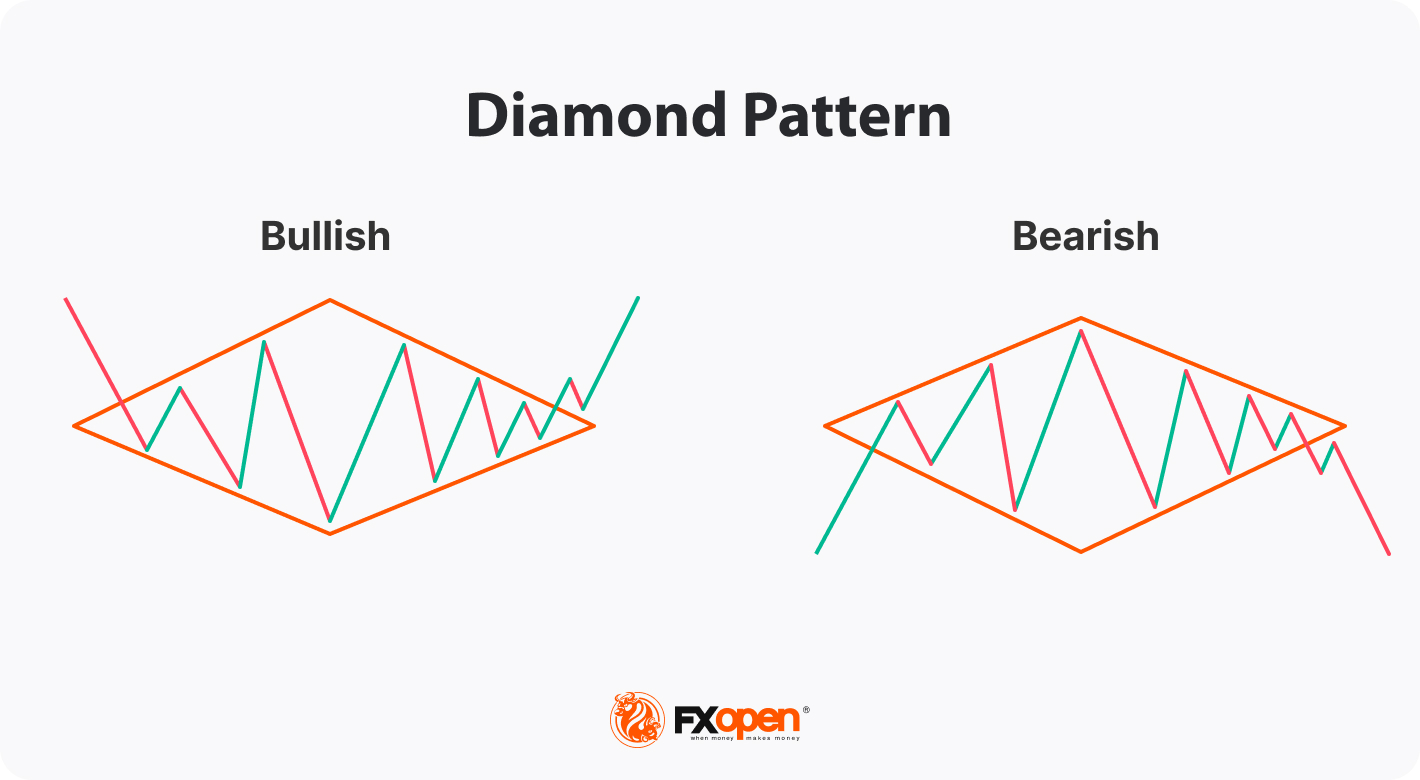
The diamond pattern is characterised by a series of higher highs and lower lows, which are then turned into lower highs and higher lows, regardless of the trend direction. This formation indicates that buyers and sellers are in a state of equilibrium, with neither of them able to gain control of the price. The breakout from the diamond formation is typically expected to occur in the opposite direction to the prevailing trend; that is, down after an uptrend and up after a downtrend.
Like most chart patterns, this formation has particular rules traders can use to build their own trading strategies. These rules can be applied to the diamond pattern in forex, stock, commodity, and cryptocurrency* markets.
The diamond pattern is typically followed by a breakout, which is a significant price movement outside it. The breakout can occur in either direction, indicating a potential trend reversal. If the breakout occurs above the upper trendline after a downtrend, it signals a bullish reversal. On the other hand, in the bearish diamond pattern, the breakout occurs below the lower trendline, which signals a bearish reversal.
The breakout should be accompanied by an increase in trading volume, which adds further confirmation to its validity. Low trading volumes usually signal a false breakout, whereby the price returns to its previous trend after a breakout. False breakouts can be caused by market volatility, news events, or other factors that disrupt its validity.
Traders may also use multiple timeframe analysis for confirmation. For example, if a diamond is forming on the hourly chart, traders may look at higher timeframes, such as the 4-hour or daily chart, to confirm the breakout direction. If the breakout aligns with the trend on multiple time frames, it may provide a stronger trading signal.
Once the breakout occurs, traders can use the diamond to project a potential price target. To do this, they can measure the vertical distance between the widest part of the formation (the distance between the highest high and the lowest low) and add that distance to the breakout point in the bullish formation and subtract this distance in the bearish formation.
Although the diamond is primarily considered a reversal formation, it can also indicate the continuation of an existing trend. Traders can see it appearing within the context of a strong trend and interpret it as a pause before it resumes.
In the case of a diamond continuation pattern, traders will go short on the breakout of the lower trendline of the diamond formation in a downtrend and go long on the breakout of the upper trendline in an uptrend. Still, the profit target will be calculated similarly to the reversal formation.
The diamond formation is commonly compared to the head and shoulders setup. However, they have different trading rules; therefore, it’s vital to learn how to distinguish between them.
The head and shoulders formation consists of three peaks, with the middle peak (the head) being higher than the other two peaks (the shoulders) and is formed at the end of an uptrend. The inverse head and shoulders pattern consists of three troughs, with the middle one being lower (head) than the other two troughs, and it appears at the end of a downtrend. On the other hand, the diamond is characterised by a series of higher highs and lower lows which turn into lower highs and higher lows.
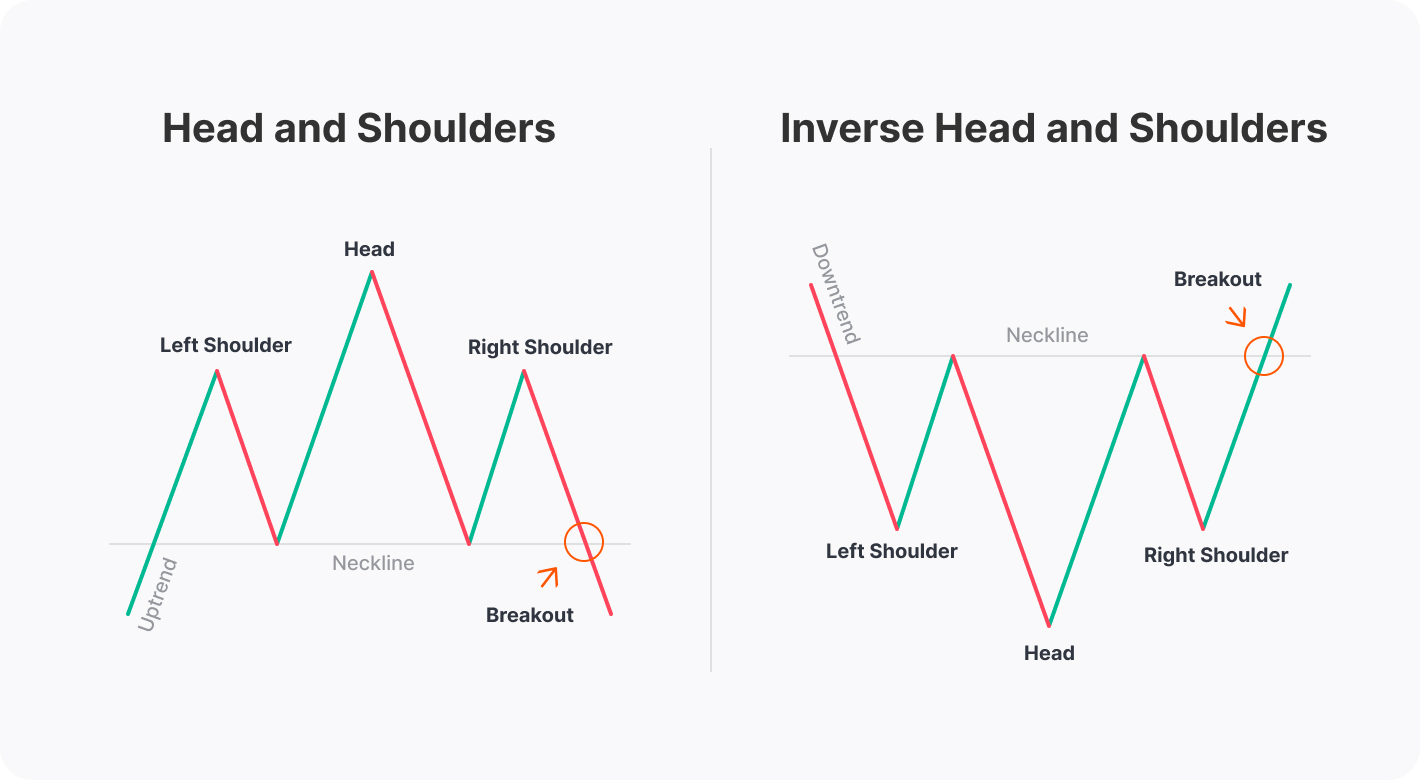
When trading the (inverse) head and shoulders pattern, traders measure the distance between the head and the neckline (the line drawn through troughs in the head and shoulders and through peaks in the inverse head and shoulders) and add it to the breakout point.
This formation can be used in various trading strategies. Here are some common approaches that traders can utilise.
One of the most straightforward strategies is to trade breakouts. Traders can wait for the price to break above the upper trendline in a diamond bottom trading pattern or below the lower trendline in a diamond top trading pattern and then enter the market in the breakout direction. Traders usually place a stop-loss order below the lower line in a bullish formation or above the upper line in a bearish formation or consider the risk-reward ratio. A trader can consider a trailing stop-loss option. If they trade in a solid trend, a take-profit target can be trailed the same as the stop-loss point.
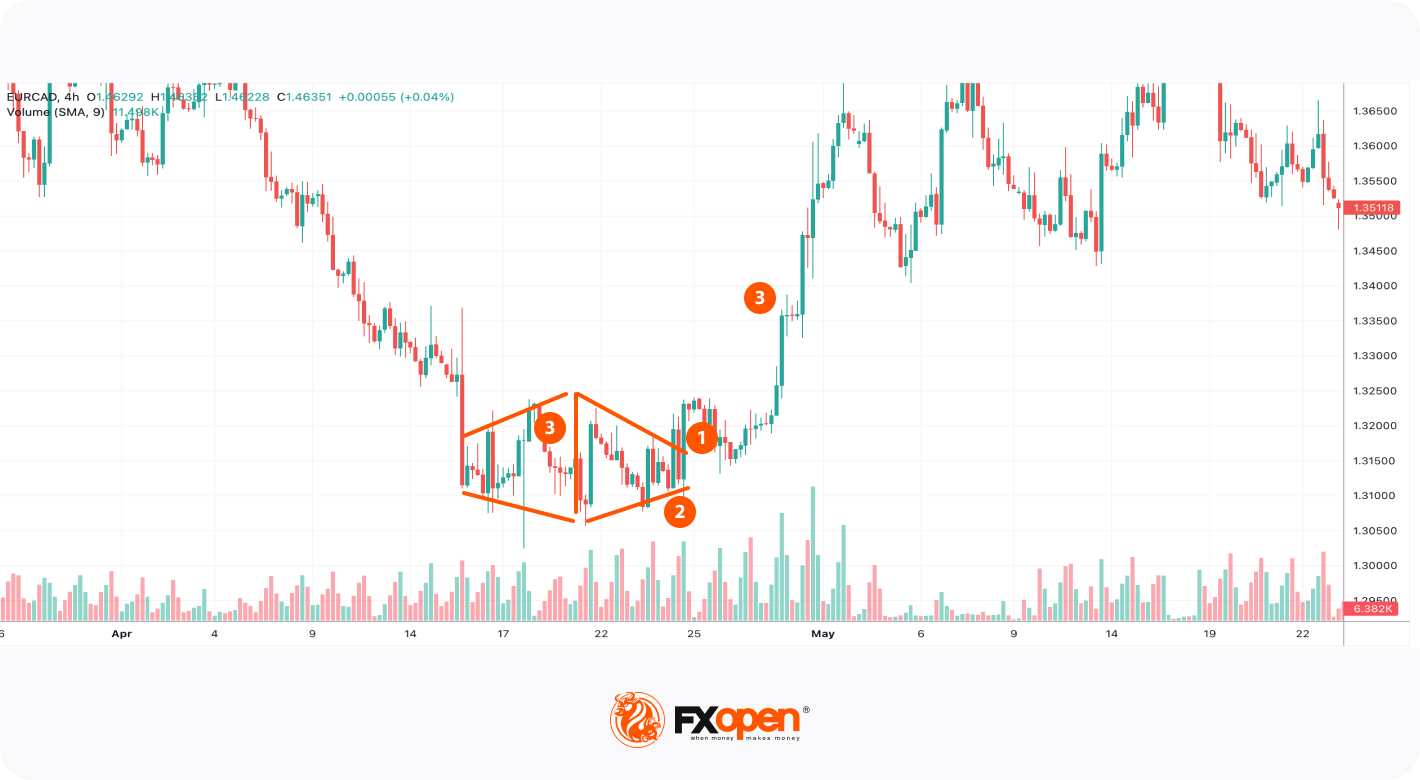
In the chart above, the price formed a bullish diamond after a prolonged downtrend. The price broke above the upper line (1). However, it couldn’t stay there and later returned to the pattern. The volumes on the breakout increased significantly, so a trader could have expected bulls to try again. If a trader had placed a stop-loss level below the lower line, the price return wouldn’t have affected the trade (2). The price broke above the upper line again and continued rising. A trader could have measured the distance between the highest and the lowest points and added this to the breakout point (3). The bullish trend was strong, so a trader could have trailed that take-profit target.
Another strategy is to look for price retracements after the breakout. Traders can wait for the price to retest the broken trendline after the breakout and then enter a trade in that direction. A profit target will also be calculated based on the distance between the highest and the lowest points. The distance will be added to the breakout point in the bullish formation or subtracted from the breakout point in a bearish formation. A stop-loss order will be placed below the retracement level in the bullish pattern and above the retracement level in the bearish pattern. In this approach, traders usually use a limit order. Trailing stop-loss and take-profit orders can be applied to this approach too.
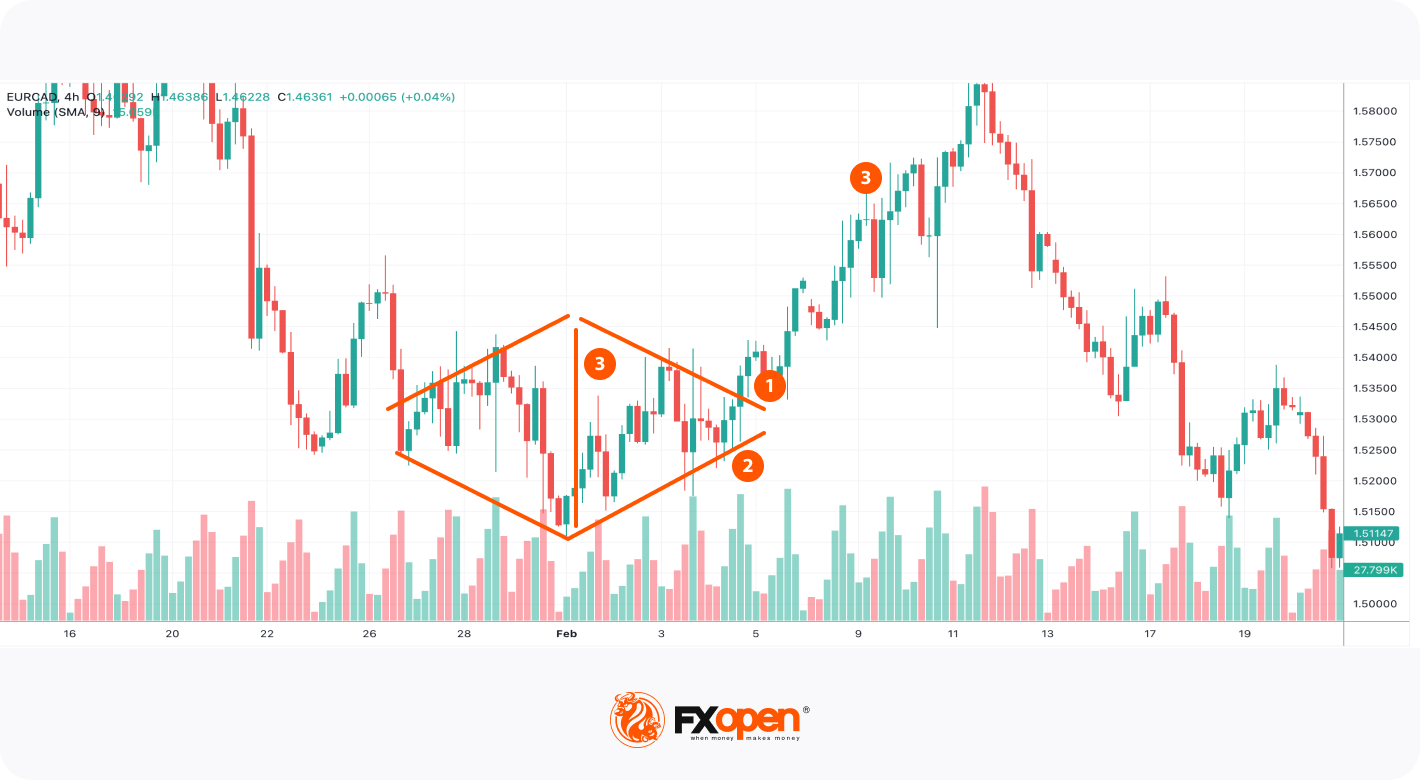
In the chart above, the price formed a diamond bottom pattern. It broke above the formation's upper line, but it retested the pattern later (1). A trader could have placed a buy limit order at the upper line. A stop-loss could have been placed below the lower line (2), while a take-profit target could have equalled the distance between the highest and the lowest points of the formation (3).
This strategy may support traders in catching potential trend reversals. However, there is a risk of a missing trade as the price may keep moving in a breakout direction without a retracement.
If you want to practice these trading approaches, you may consider opening an account on FXOpen’s TickTrader trading platform and access numerous technical analysis tools and assets.
While the diamond can be a valuable tool, it is not without limitations.
The diamond is a popular chart pattern in technical analysis. It can be observed across asset classes, including cryptocurrencies*, stocks, currencies, and commodities. Like any trading model, it has limitations that should be considered before applying it in live market conditions. Incorporating risk management, analysing multiple timeframes, and accounting for broader market context is believed to be important when dealing with this formation.
If you want to apply the diamond pattern in real trading, you may consider opening an FXOpen account to access over 700 markets and trade with low commissions from $1.50 and tight spreads from 0.0 pips.
*Important: At FXOpen UK, Cryptocurrency trading via CFDs is only available to our Professional clients. They are not available for trading by Retail clients. To find out more information about how this may affect you, please get in touch with our team.


