
Polkadot (DOT) continues to trade under pressure on April 24, 2026, as sellers maintain control across key timeframes. The asset remains close to a major demand zone, with price action showing limited recovery signals and weak participation from buyers in recent sessions.
As of press time, Polkadot (DOT) trades at $1.22 after a 4.09% daily decline, reflecting continued market pressure. The token has also dropped 9.05% over the past week, while trading volume decreased 15.45% to $132.72 million, according to CoinMarketCap data.

Also Read: Celestia (TIA) Price Trend Suggests Gradual Reversal Toward $0.40 Breakout
Analyst Crypto Patel highlighted the formation of a long-term structure on DOT charts. He noted that the asset has fallen by almost 98 percent of its high of over $55. The price is currently trading in a high-timeframe accumulation zone that is in between $1.20 and $1.00.
The analyst noted a squeeze in a multi-year falling channel. This structure is positioned near a demand zone. He singled out the level of $2.35 as one of the important levels of bullish confirmation. A prolonged trend of higher than this would indicate a structural change.

He gave several upside targets in case the trend changes. These include $2, $5, $10, $20, and $50. He further said that a weekly close of less than $0.90 would nullify this perspective. These are levels that establish the existing range of market participants.
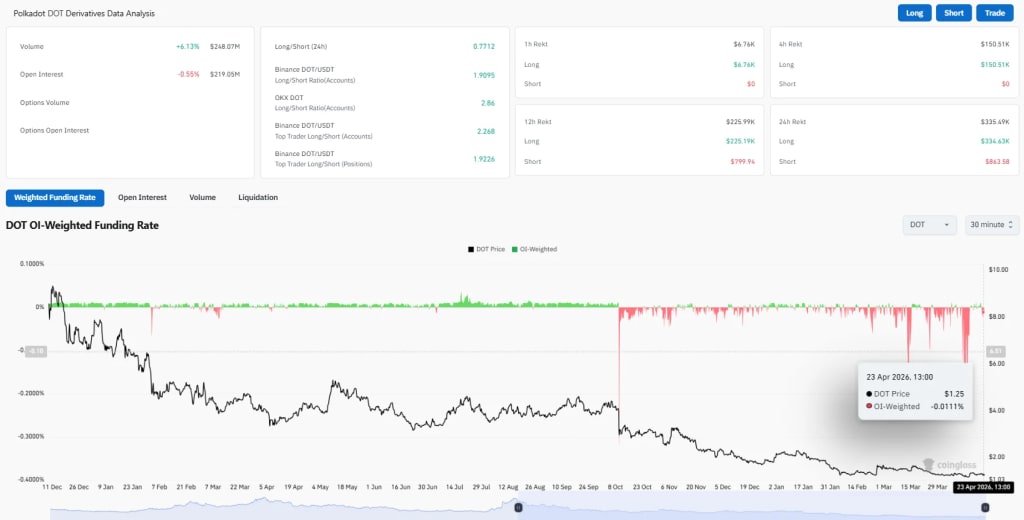
According to the CoinGlass data, the trading volume increased by 6.13% to $248.07 million. Nonetheless, open interest decreased by 0.55% to $219.05 million. The OI-weighted funding rate is negative at -0.0111%, showing that there is a short bias in the market.
According to TradingView data, DOT remains below its short-term exponential moving averages, showing continued weakness. The 20-day EMA is at 1.273, while the 50-day EMA stands at 1.346. Both levels are higher than the current price and serve as short-term resistance areas.
The pressure is also reflected in the longer-term trend. The 100-day EMA is positioned at 1.539, and the 200-day EMA is at 2.032. There is a greater disparity between these levels and the current price. The form shows a long-term bearish correlation over time.

The Relative Strength Index (RSI) is at 43.09, and the moving average stands at 44.26. The indicator is not above the neutral 50 mark and has a minimal upward trend. Such a stance indicates the lack of buying momentum and indicates that the strength of bulls is yet to be restored.
The price action is near the bottom of the recent price range. The zone of $1.20 remains a critical level. Traders are looking to see either a rise or fall above resistance or a fall or rise below support in order to determine the next direction.
This article contains market analysis and price predictions. These are not guarantees. Crypto markets are volatile. Always DYOR. Not financial advice.
Also Read: Polkadot Price Prediction: Can DOT Rally to $3.40 After Channel Breakout?

