Ethereum price traded near $2,507 on September 13. Analyst Ali linked a possible run to $3,000 to a weekly close above $2,550.
Bitcoin sat around $77,329 at the same time. XRP traded near $1.36, and Solana held close to $101.19.
Crypto analyst Ali Charts pointed to a triangle forming on Ethereum’s 12-hour chart. The pattern echoes an earlier setup that came before a fast move higher.
Ali Charts wrote on X that the last triangle breakout sent ETH up 31% in three days. The analyst added that a new breakout from the current triangle could send Ethereum toward $3,000, though the target is not a guaranteed outcome.
A clean break above resistance would support that case. A drop below the rising support line inside the triangle would weaken it.
Ethereum ETFs took in $216.41 million in net inflows on September 11. BlackRock’s ETHA led the day with $148.82 million.
Bitwise’s ETFW brought in $29.09 million. ETHB added $18.32 million, and Fidelity’s FETH brought in $11.40 million.
Grayscale’s ETH mini fund drew $5.09 million. VanEck’s ETHV added $3.71 million, while Grayscale’s ETHE and Franklin’s EZET recorded no new inflows.
Total historical inflows for Ethereum ETFs stand at $13.39 billion. Net assets across the funds reached $16.31 billion, equal to 5.28% of Ethereum’s market cap.
Trading volume across the funds hit $2.56 billion on September 11.
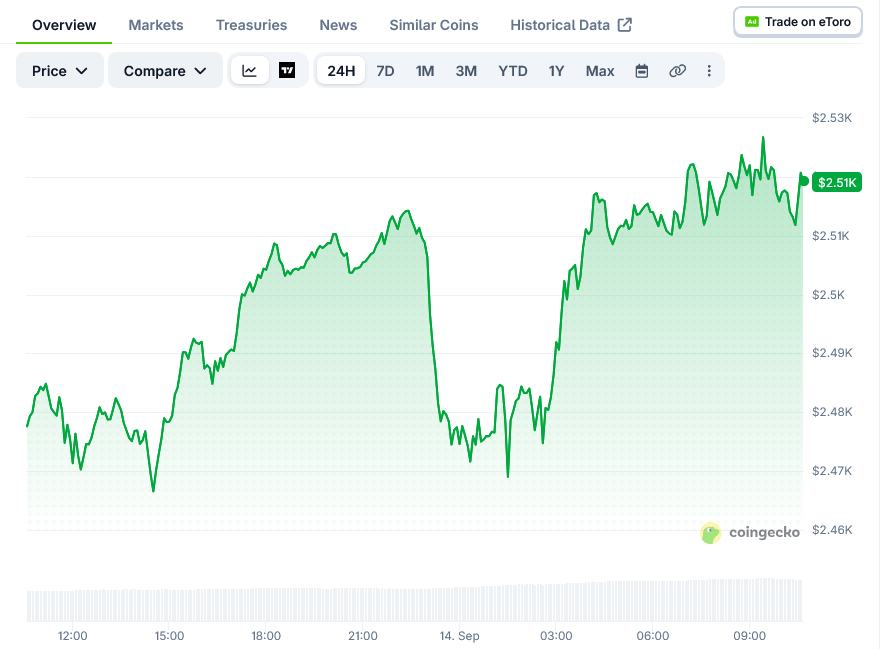
Ethereum traded at $2,506 on the September 13 four-hour chart, up 0.73% during that candle. The price has moved mostly sideways since late August, after climbing from lows near $2,000.
A brief spike to $2,600 on September 11 did not hold. Price slid back down toward $2,500 shortly after.
The MACD line sat at 6.47, below its signal line of 9.24. The histogram read -2.76, pointing to weaker upward momentum.
RSI measured 51.77, keeping Ethereum just above the neutral 50 mark.
A move past $2,510 would put $2,550 back in focus, followed by the recent high near $2,600. A drop under $2,490 could bring the $2,400 support level into play.
Investors are also watching the Federal Reserve meeting scheduled for September 15-16. A September 15 procedural vote on the CLARITY Act is another event traders are tracking this week.
The post Ethereum (ETH) Price: Analyst Says $3,000 Is Possible This Week appeared first on Blockonomi.





